2025-02-18 05:25
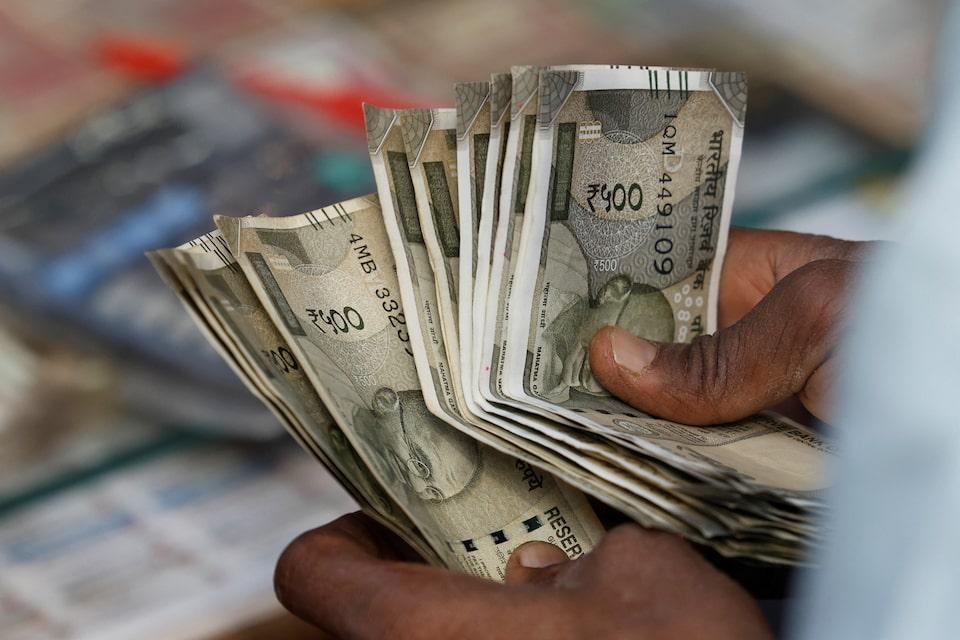
MUMBAI, Feb 18 (Reuters) - The Indian rupee weakened slightly on Tuesday as the impact of weak regional currencies and heightened dollar demand - spurred by positions in the non-deliverable forwards market - was blunted by likely dollar-selling by the central bank. The rupee was at 86.9550 against the U.S. dollar as of 10:50 a.m. IST, down from its close of 86.8775 in the previous session. Heightened appetite for dollars at the daily reference rate weighed on the rupee, a trader at a foreign bank said. The reference rate, or the daily fix, was last quoted at a 0.30/0.50 paisa premium, signalling strong dollar bids, per the trader. However, state-run banks were spotted offering dollars in early trading near the 86.94-86.95 levels, most likely on behalf of the Reserve Bank of India, which capped the currency's losses traders said. Asian currencies weakened between 0.1% to 0.4% as the dollar index rose nearly 0.3% to 107, extending its recovery from a two-month low hit last week. U.S. bond yields nudged higher as well, with the 10-year Treasury yield up four basis points at 4.51%. The 1-year U.S. Treasury yield also rose, hurting dollar-rupee forward premiums. The dollar-rupee 1-year implied yield was last quoted lower by two bps at 2.11%, its lowest level in over two months. Growing expectations that the Federal Reserve will keep policy rates on pause and that the RBI will deliver a cut at its April meeting are likely to weigh on far forwards, a swap dealer at a bank said. "In the lead-up to the April meeting, expect the 1-year to touch its support level at 1.95%," the dealer said. Fed officials have also signalled caution about future rate cuts in recent remarks, with Fed Governor Michelle Bowman saying she wanted increased conviction that inflation will decline further this year before lowering interest rates again. Sign up here. https://www.reuters.com/markets/currencies/rupees-dip-cushioned-by-likely-rbi-intervention-forward-premiums-decline-2025-02-18/
2025-02-18 03:40
SYDNEY, Feb 18 (Reuters) - The Reserve Bank of Australia on Tuesday cut its cash rate by 25 basis points to 4.10% following a monthly policy meeting. The following is a chronology of the Reserve Bank of Australia's interest rate moves since 1990. Each move is measured in basis points (bp), which are one-hundredths of a percentage point. Feb 18 2025 Down 25 bp to 4.10 Nov 7 2023 Up 25 bp to 4.35 Jun 6 2023 Up 25 bp to 4.10 May 2 2023 Up 25 bp to 3.85 Mar 7 2023 Up 25 bp to 3.60 Feb 7 2023 Up 25 bp to 3.35 Dec 6 2022 Up 25 bp to 3.10 Nov 1 2022 Up 25 bp to 2.85 Oct 4 2022 Up 25 bp to 2.60 Sep 6 2022 Up 50 bp to 2.35 Aug 2 2022 Up 50 bp to 1.85 Jul 5 2022 Up 50 bp to 1.35 Jun 7 2022 Up 50 bp to 0.85 May 3 2022 Up 25 bp to 0.35 Nov 3 2020 Down 15 bp to 0.10 Mar 19 2020 Down 25 bp to 0.25 Mar 3 2020 Down 25 bp to 0.50 Oct 1 2019 Down 25 bp to 0.75 Jul 2 2019 Down 25 bp to 1.00 Jun 4 2019 Down 25 bp to 1.25 Aug 2 2016 Down 25 bp to 1.50 May 3 2016 Down 25 bp to 1.75 May 5 2015 Down 25 bp to 2.00 Feb 3 2015 Down 25 bp to 2.25 Aug 6 2013 Down 25 bp to 2.50 May 7 2013 Down 25 bp to 2.75 Dec 4 2012 Down 25 bp to 3.00 Oct 2 2012 Down 25 bp to 3.25 Jun 5 2012 Down 25 bp to 3.50 May 1 2012 Down 50 bp to 3.75 Dec 6 2011 Down 25 bp to 4.25 Nov 1 2011 Down 25 bp to 4.50 Nov 2 2010 Up 25 bp to 4.75 May 4 2010 Up 25 bp to 4.50 Apr 6 2010 Up 25 bp to 4.25 Mar 2 2010 Up 25 bp to 4.00 Dec 1 2009 Up 25 bp to 3.75 Nov 3 2009 Up 25 bp to 3.50 Oct 6 2009 Up 25 bp to 3.25 Apr 7 2009 Down 25 bp to 3.00 Feb 3 2009 Down 100 bp to 3.25 Dec 2 2008 Down 100 bp to 4.25 Nov 4 2008 Down 75 bp to 5.25 Oct 7 2008 Down 100 bp to 6.00 Sep 2 2008 Down 25 bp to 7.00 Mar 4 2008 Up 25 bp to 7.25 Feb 5 2008 Up 25 bp to 7.00 Nov 7 2007 Up 25 bp to 6.75 Aug 8 2007 Up 25 bp to 6.50 Nov 8 2006 Up 25 bp to 6.25 Aug 2 2006 Up 25 bp to 6.00 May 3 2006 Up 25 bp to 5.75 Mar 2 2005 Up 25 bp to 5.50 Dec 3 2003 Up 25 bp to 5.25 Nov 5 2003 Up 25 bp to 5.00 June 5 2002 Up 25 bp to 4.75 May 8 2002 Up 25 bp to 4.50 Dec 5 2001 Down 25 bp to 4.25 Oct 3 2001 Down 25 bp to 4.50 Sept 5 2001 Down 25 bp to 4.75 Apr 4 2001 Down 50 bp to 5.0 Mar 7 2001 Down 25 bp to 5.5 Feb 7 2001 Down 50 bp to 5.75 Aug 2 2000 Up 25 bp to 6.25 May 3 2000 Up 25 bp to 6.0 Apr 5 2000 Up 25 bp to 5.75 Feb 2 2000 Up 50 bp to 5.5 Nov 3 1999 Up 25 bp to 5.0 Dec 2 1998 Down 25 bp to 4.75 Jul 30 1997 Down 50 bp to 5.0 May 23 1997 Down 50 bp to 5.5 Dec 11 1996 Down 50 bp to 6.0 Nov 6 1996 Down 50 bp to 6.5 Jul 31 1996 Down 50 bp to 7.0 Dec 14 1994 Up 100 bp to 7.5 Oct 24 1994 Up 100 bp to 6.5 Aug 17 1994 Up 75 bp to 5.5 Jul 30 1993 Down 50 bp to 4.75 Mar 23 1993 Down 50 bp to 5.25 Jul 8 1992 Down 75 bp to 5.75 May 6 1992 Down 100 bp to 6.5 Jan 8 1992 Down 100 bp to 7.5 Nov 6 1991 Down 100 bp to 8.5 Sep 3 1991 Down 100 bp to 9.5 May 16 1991 Down 100 bp to 10.5 Apr 4 1991 Down 50 bp to 11.5 Dec 18 1990 Down 100 bp to 12.0 Oct 15 1990 Down 100 bp to 13.0 Aug 2 1990 Down 100 bp to 14.0 Apr 4 1990 Down 100-150bp to 15.0 to 15.5 Feb 15 1990 Down 50 bp to 16.5 to 17.0 Jan 23 1990 Down 50-100bp to 17.0 to 17.5 Sign up here. https://www.reuters.com/markets/rates-bonds/australian-interest-rate-changes-since-1990-2025-02-18/
2025-02-18 02:43
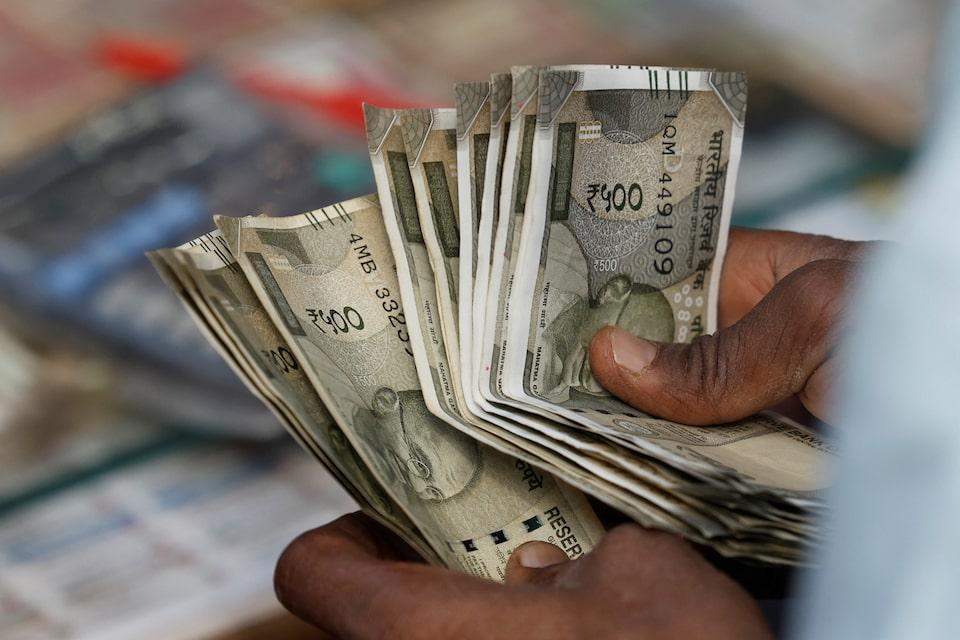
MUMBAI, Feb 18 (Reuters) - The Indian rupee is likely to face pressure on Tuesday due to heightened dollar demand spurred by the maturity of positions in the non-deliverable forwards (NDF) market, while a dip in regional peers and portfolio outflows may add to the headwinds. The 1-month non-deliverable forward indicated that the rupee will open at 86.93-86.94 to the U.S. dollar, compared with 86.8775 in the previous session. Bids to buy dollars at the daily reference rate are likely to be elevated due to the maturity of large positions in the NDF market, three traders said. The cumulative size of the maturities is estimated to be around $4 billion, a Singapore-based trader at a bank said. A decline in Asian currencies is also likely to weigh on the rupee with its peers down between 0.1% to 0.3%. The dollar index was up 0.1% at 106.9, recovering slightly from its lowest level in about two months. "Unless you have a strong conviction that the U.S. activity data is going to decelerate sharply from here... it looks like we're getting towards the end of this dollar correction," ING Bank said in a note. Meanwhile, persistent foreign portfolio outflows have also hurt the rupee, with overseas investors having net pulled out about $12 billion from local stocks in 2025 so far. The rupee has weakened about 1.5% year-to-date and is among the worst performing regional currencies. It declined to an all-time low of 87.95 last week and might have had to endure deeper losses had it not been for the Reserve Bank of India's stern interventions, which have blunted speculative bets against the currency. Traders expect the central bank to continue stepping into the market to prevent excessive volatility. KEY INDICATORS: ** One-month non-deliverable rupee forward at 87.12; onshore one-month forward premium at 19.50 paisa ** Dollar index up 0.1% at 106.87 ** Brent crude futures down 0.2% at $75.1 per barrel ** Ten-year U.S. note yield at 4.51% ** As per NSDL data, foreign investors sold a net $578.2 million worth of Indian shares on February 14 ** NSDL data shows foreign investors sold a net $30.6 million worth of Indian bonds on February 14 Sign up here. https://www.reuters.com/markets/currencies/maturity-ndf-positions-dip-asian-peers-likely-weigh-rupee-2025-02-18/
2025-02-18 00:15
Woodside, Santos expected to deliver lower FY profits Analysts question sustainability of Woodside's payout ratio Santos' update on Pikka, Barossa projects key Feb 18 (Reuters) - Woodside Energy (WDS.AX) , opens new tab and Santos (STO.AX) , opens new tab, Australia's top oil and gas producers, are expected to log a modest fall in annual earnings, with investors seeking more clarity on dividend payouts amid lingering execution risks to key growth projects. The primary reason for an annual profit decline will be softer energy prices, according to John Lockton, head of investment strategy at Sandstone Insights. "Flat volumes combined with flat energy prices leave revenue growth flat (for both companies)in US$ terms," he told Reuters. Woodside is forecast to report an underlying net profit of $2.96 billion for fiscal 2024, according to Visible Alpha consensus estimates, down from $3.32 billion last year. In a line-item forecast released on Monday, Woodside said it expects higher restoration costs for the year, along with "other expenses" of $1.7 billion to $1.9 billion - both much higher than consensus estimates. Doubts about the company's growth projects have been heightened by its projection for its Sangomar project in Senegal to maintain a production plateau into the second quarter of 2025. "Higher restoration costs will see cash flow downgrades, and the potential earlier Sangomar decline would also be a cash drag. This will raise questions about the sustainability of the payout ratio," Citi analysts said in a note. Woodside is also yet to assess whether potential tariffs would have a negative impact on a stake sell-down for its Louisiana liquefied natural gas (LNG) project, said analysts at Jarden, as investors wait for evidence the company is controlling costs. Woodside fully owns the Louisiana LNG project after its $1.2 billion acquisition of developer Tellurian Inc in October but is looking to sell a 50% stake. For smaller peer Santos, the focus will be on construction progress of its Pikka Phase 1 project in Alaska, with investors looking for indications whether acceleration of first oil production into late 2025 is possible, Jarden analysts said. Last month, Santos said first gas from its nearly completed $4.3 billion Barossa project is expected in the third quarter this year. "We see some risk that Santos' production and capital expenditure estimates from its legacy fields are too optimistic and may need to be rebased," Sandstone's Lockton said. "Santos' new capital management policy, which should lift distribution per share payments by around 20%, will also be on display." Santos is expected to report an annual underlying profit of $1.32 billion, according to consensus estimates, lower than last year's $1.42 billion. Santos and Woodside are due to release their annual earnings updates on February 19 and February 25, respectively. Sign up here. https://www.reuters.com/business/energy/woodside-santos-face-earnings-dip-growth-projects-focus-2025-02-18/
2025-02-18 00:08
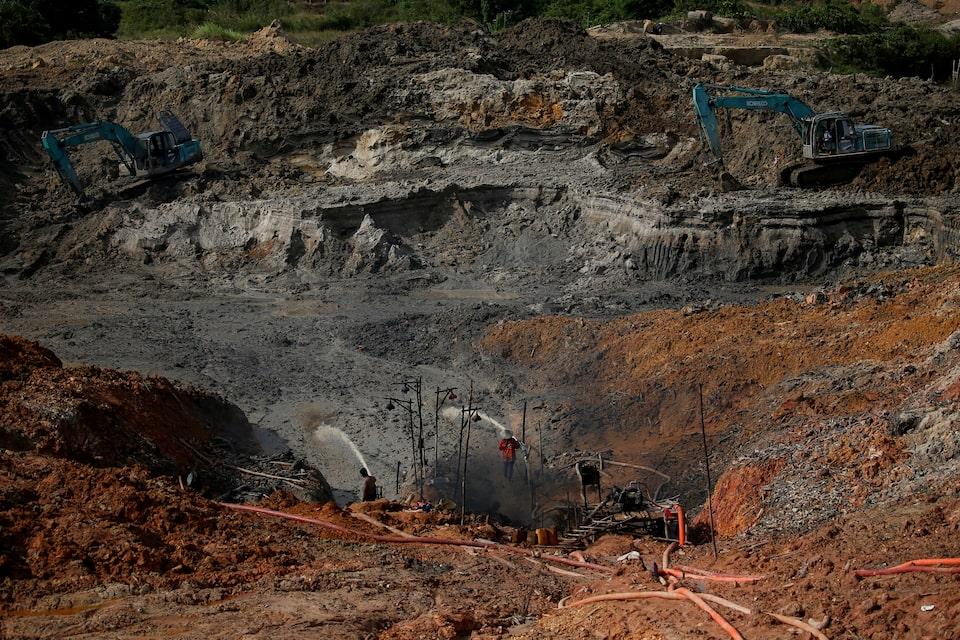
Religious groups, small businesses allowed priority access to mines Companies with value-add plans also allowed priority access Some miners obliged to put domestic market first Indonesia major producer of coal, metal ores JAKARTA, Feb 18 (Reuters) - Indonesia's parliament on Tuesday passed a bill to revise the country's mining law, aimed at boosting development of domestic mineral processing industries and regulating mining access for small businesses and religious groups. The amendment seeks to encourage the participation of smaller-scale firms in mining and to ensure ore supply security for mineral processing industries, as resource-rich Indonesia seeks to further develop its domestic metals sector. Indonesia is the world's top nickel producer and thermal coal exporter and has rich deposits of tin, copper and bauxite, among other metals. The amended law gives companies that aim to build processing facilities priority access to mining concessions, taking into account the size of their investment, the value addition and job creation. Miners at the so-called "Operation Production" stage will be required to prioritise supplying their products to the domestic market over exports, according to a copy of the bill reviewed by Reuters. The rule will be detailed in a separate regulation, the bill said. "This amendment is in line with the government's aspiration to reform governance of mineral and coal mining," Energy and Mineral Resources Minister Bahlil Lahadalia told parliament after a plenary vote that passed the bill. Holders of mining contracts under Indonesia's old licensing system will be required to undergo an environmental audit before they are granted an extension and conversion into the new mining permit system. Religious groups, through a business unit under their control, and small- to medium-sized businesses will be allowed priority access to certain mining areas. In the past, such priority access has only been given to state-owned companies. Universities were previously included in the parties allowed for priority access, but were later removed. Instead, priority will be given to certain government-controlled or private businesses to manage a mining area for the benefit of the universities, such as for research and scholarship funds. Over a thousand university students staged protests in several cities on Monday to reject the proposed university participation in mining, among other demands. The mining law was revised partly to satisfy a 2021 constitutional court order. The court had ruled that some mining provisions were unconstitutional. Sign up here. https://www.reuters.com/world/asia-pacific/indonesian-parliament-set-vote-amendment-mining-law-2025-02-18/
2025-02-18 00:01
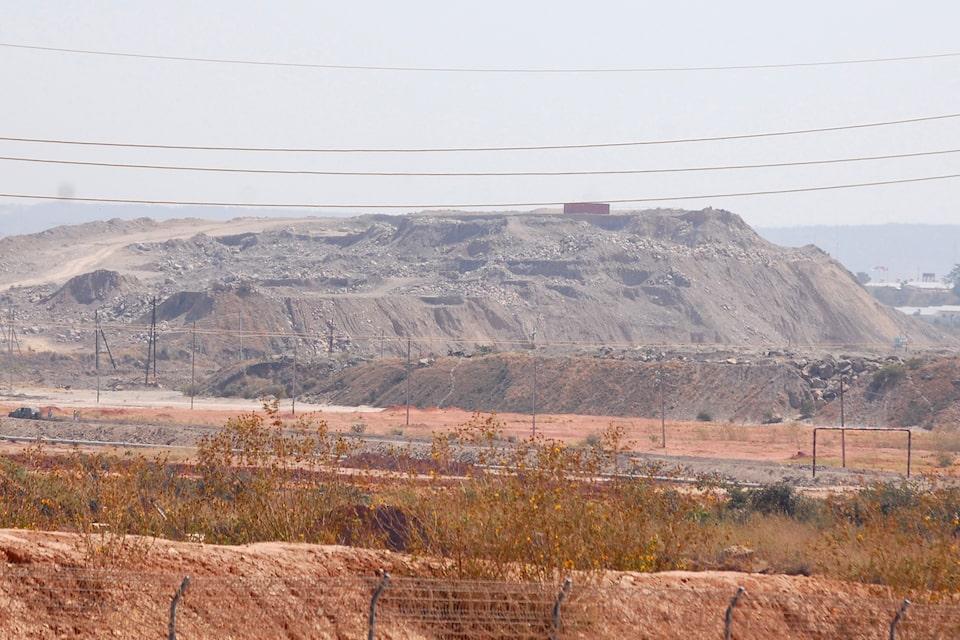
LONDON, Feb 17 (Reuters) - China is reaping the rewards of its massive mining investment in the Democratic Republic of Congo in the form of surging imports of physical copper. Shipments of refined copper from the central African country jumped by 71% year-on-year to 1.48 million metric tons in 2024. The Congo is now by some margin the largest supplier of refined metal to the world's largest buyer. Chinese operators dominate Congo's copper belt and the flow of metal between the two countries is emerging as a new structural dynamic in the global market. However, it is one that risks diminishing the usefulness of reading China's copper import pulse as a gauge of Chinese demand. Total imports of refined copper last year were the second highest on record but how much was demand pull and how much African supply push? IMPORT STRENGTH An unprecedented flurry of Chinese exports burst copper's bull bubble in the middle of last year, dousing a market narrative of shortage. But the unusual outbound flows were occasioned by an equally unusual dislocation of global arbitrage caused by a squeeze on the CME copper contract. Around 17,000 tons were shipped directly to the United States but most of China's exports went to London Metal Exchange warehouses in Taiwan and South Korea to capitalise on the price spike. The outbound flood slowed to a trickle in the second half of the year. Imports, which had remained surprisingly steady even during the export surge, accelerated over the closing months of 2024. Indeed, total imports of refined copper rose by 8.6% year-on-year to 4.04 million tons in 2024, a level exceeded only in 2020, when imports reached 4.67 million tons. China's own production of refined copper also rose by a robust 5.4%, or 620,000 tons, last year, according to local data provider Shanghai Metal Market. The combination of strong domestic production and high imports signals a demand recovery that is not confirmed by either macroeconomic indicators or by the copper price. China's official PMI showed manufacturing activity contracting in January, while LME three-month copper is struggling to hold the $9,500-per ton level let alone challenge last year's highs above $10,000. CONGO RISING China's copper imports may be rising simply because Congo's production is rising and the country's output goes by default to China. China's CMOC Group (603993.SS) , opens new tab has swamped the cobalt market with excess supply from its Congo operations but the cobalt is just a by-product of the copper. The company's copper output has surged, jumping by 55% year-on-year to 650,000 tons in 2024. Other Chinese operators are also still ramping up their copper investments and the Congo has overtaken Peru as the world's second largest producer after Chile. Chilean metal used to dominate China's copper import mix but shipments fell to an 18-year low of 578,000 tons in 2024 and accounted for just 14.3% of the total intake. The Congo's share of Chinese copper imports has risen from 10% in 2020 to 36.7% with volumes steadily increasing over the fourth quarter. December's imports of 167,735 tons were a new monthly record. The Lobito Corridor project, which will upgrade the railway between the Angolan port of Lobito and Congo's copper mines, should facilitate more exports to the West. Lobito Atlantic Railways transported its first shipment , opens new tab of DRC copper destined for the United States in August last year. But Chinese-owned mines can be expected to continue shipping most of their metal to China unless there is a strong financial incentive to redirect it to other markets. LIMITED EXCHANGE OPTIONS The incentive is unlikely to come in the form of exchange delivery. CME has no registered brands of DRC copper and the LME has only two - "SCM" and "COMIKA". They represent 122,400 tons of annual production, which is a drop in Congo's copper production. Registered LME stocks of DRC copper stood at just 3,775 tons at the end of December. The Shanghai Futures Exchange doesn't have any registered Congo brands either, meaning that the metal tends to trade at a discount in the Chinese domestic market. The lack of exchange delivery options has caused Congo's supply surge to bypass visible stocks and head straight for the shadows of the Chinese physical market. There's no reason to expect that to change as the Congo takes its place as the core component of China's drive for supply-chain security. As Congo's production expands, so too will the flow of metal to China, whatever the state of Chinese demand. The opinions expressed here are those of the author, a columnist for Reuters. Sign up here. https://www.reuters.com/markets/commodities/congo-emerges-chinas-strategic-copper-supplier-andy-home-2025-02-17/