


like_count_tpl like_count_text_tpl
like_tooltip_tpl
comment_count_tpl comment_count_text_tpl
comment_tooltip_tpl
Economic Updates
India Economics: India: Feeling the heat

Key takeaways
- Average temperatures are rising; the sensitivity of food prices across each category to temperatures has risen sharply.
- In fact, temperatures have become far more useful than rains in forecasting food inflation.
- Normalising temperatures in recent months will likely open the door for RBI easing in 4Q2024; but over time, with average temperatures rising, inflation management could get harder.
A couple of years ago, we pointed out that reservoir levels matter more than rains for India’s food production and inflation. In this report, we go a step further, moving from rains and reservoirs to temperatures. We find that temperatures do a much better job in explaining and predicting food output and inflation.
Average temperatures and their volatility have risen over time. Global warming is indeed a well-documented reality. In India, the impact of the March 2022 and March 2024 heatwaves are fresh in the mind. The correlation between average temperatures and India’s food inflation has risen sharply over the last decade. And this is true across individual food groups –perishable crops, durable crops, and animal protein sources.
This, then, brings us to another important question. If the importance of temperature has risen over time, what role do rains and reservoirs play? We bring out our trusted food inflation model, which explains food inflation with changes in reservoir levels, minimum support prices, and government food management steps. When we throw in temperatures, reservoir levels lose importance. They get ‘crowded out’. When we include temperatures but exclude reservoirs, the model becomes even better than before in predicting food inflation (i.e. the R-squared rises). What does this mean?
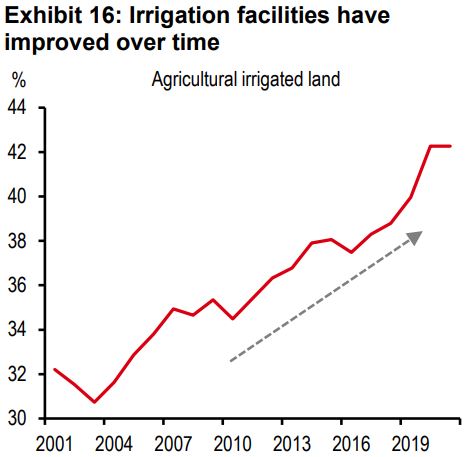
Temperatures have become far better than rainfall in explaining and forecasting food inflation. There are several possible reasons. One, with irrigation facilities improving over time, the impact of low rains can be better managed, while there’s no magic wand for rising temperatures. Two, reservoir levels and temperatures have a 50% correlation. A lot of the information contained in the reservoir variable gets picked up by temperatures. Three, there is a non-linear relationship between temperatures and food inflation. With temperatures rising, the sensitivity of non-perishable food inflation to average temperatures has grown even faster than perishables (5x vs 3x over 10 years).
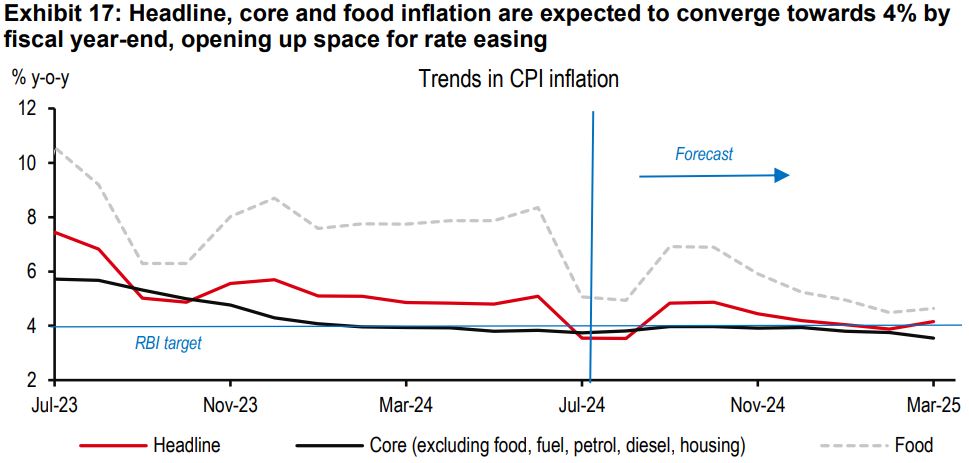
What should we expect in the short run? Following the debilitating March heatwave, temperatures have normalised. Applying our model coefficient, food inflation could fall by 2ppt over the next few months, lowering headline inflation by 1ppt. Headline inflation has averaged about 5% so far in 2024. By end-2024, headline, core, and food inflation are all likely to converge towards the 4% target, opening up space for rate easing. We expect two 25bp repo rate cuts, taking the policy repo rate to 6% by March 2025.
Forget the raindrops...
A couple of years ago, we pointed out that reservoir levels matter more than rains for India’s food production and inflation, as reservoirs not only capture contemporaneous rains, but also hold rain that has fallen in previous rain episodes. This is important at a time when unseasonal showers have increased in frequency.
In a more recent report, we pointed out that trends in reservoir levels have changed in recent years. For instance, they are much lower now in the important sowing month of July than they used to be. Not a surprise that seasonality patterns in food prices are changing too.
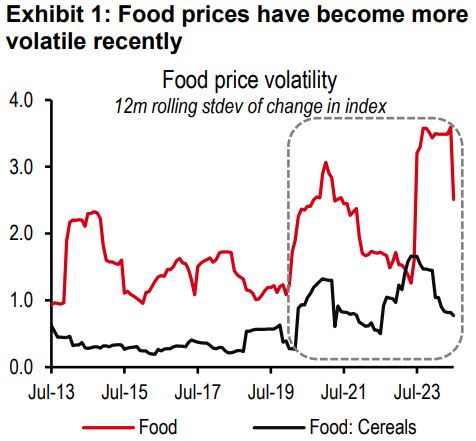
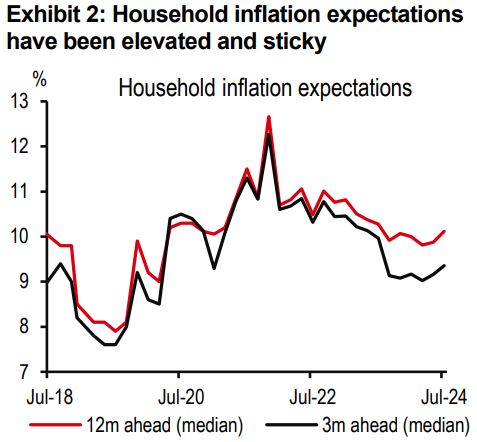
All these weather changes are making inflation more volatile and inflation expectations harder to anchor (see exhibits 1 and exhibit 2). It is no surprise that inflation forecasting errors have risen.
In this report, we take a next step, from rains and reservoirs to temperatures. True, the two are somewhat correlated. Periods of low rainfall tend to have higher temperatures.
Climate events like El Niño are associated with low rains and high temperatures, and climate events like La Niña are associated with stronger rains and lower temperatures. We find a 50% negative correlation between rains and temperatures over the last two-odd decades.
Yet, we find that temperatures carry more information than rains and do a much better job in explaining and predicting food output and inflation. There are some good reasons why you should be tracking temperatures more closely than you have in the past.
Let’s explain.
...bring out your thermometers
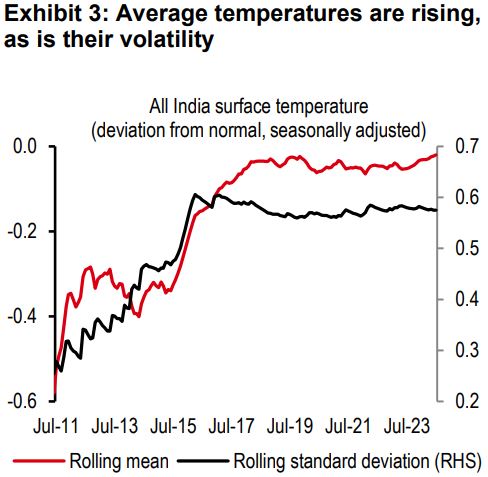
We have an extensive database of average surface temperatures across India since the 1950s. We created a monthly deviation-from-normal series, which shows that average temperatures are rising over time. And alongside this, so is temperature volatility (see exhibit 3). Neither of these is a surprise. Global warming is indeed a well-documented reality.
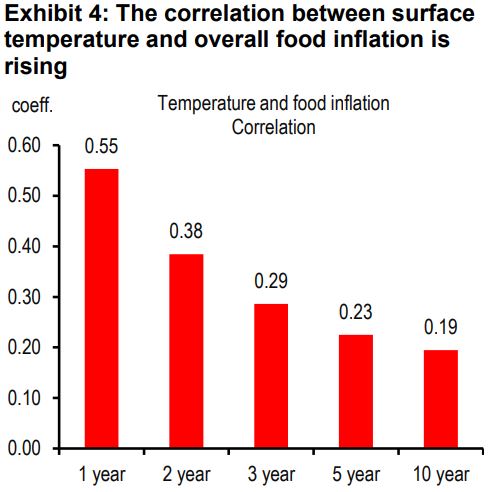
What we find next is that, with an appropriate lag, the correlation between average temperature and India’s food inflation has been rising consistently over time (see exhibit 4). As the earth is heating up, crop yields are falling.
Indeed, scientists and researchers project that a 2.5-4.9 degrees Celsius increase in temperature across the country could lead to a decrease in wheat yields of 41-52%, and a fall in rice yields of 32-40%
The heatwave of March 2022 lowered the sugar cane crop yield by 30%, while hurting the production of vegetables, as well as oilseeds. In the heatwave of March 2024, temperatures rose to 50.5 degrees Celsius in some areas, leading to heat stress. The sharp rise in vegetable prices was a reflection of the crop damage.
Temperature’s rising impact on perishable and durable food
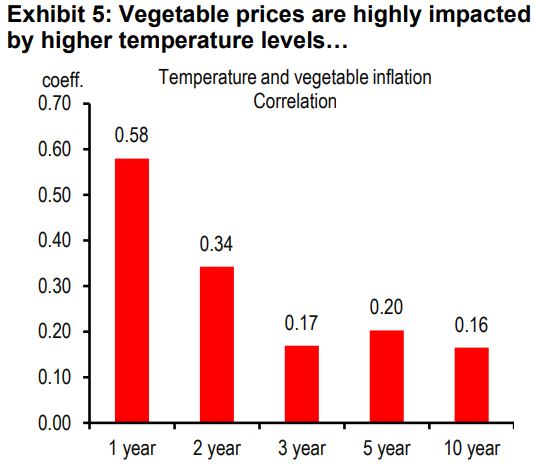
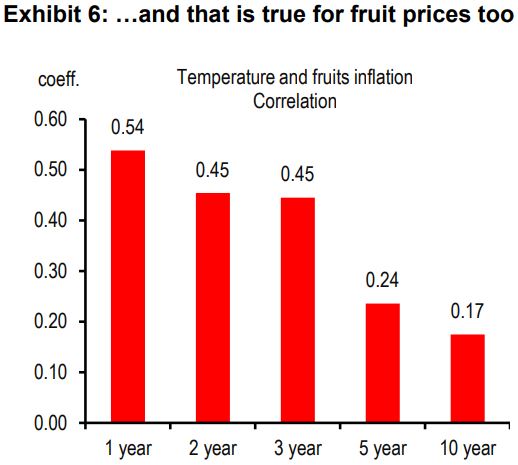
All of this is clearly visible across various food items. Analysing a decade of data, we find the correlation between average temperature and food inflation has been rising across all the main crops – perishables (vegetables and fruits) and durables (cereal, pulses, oilseeds and sugar).
And this is not just limited to crops. Even the price of dairy, poultry and fishery products, which we, on aggregate, call animal protein sources of food, are becoming increasingly sensitive to rising temperatures (see exhibits 5-12).
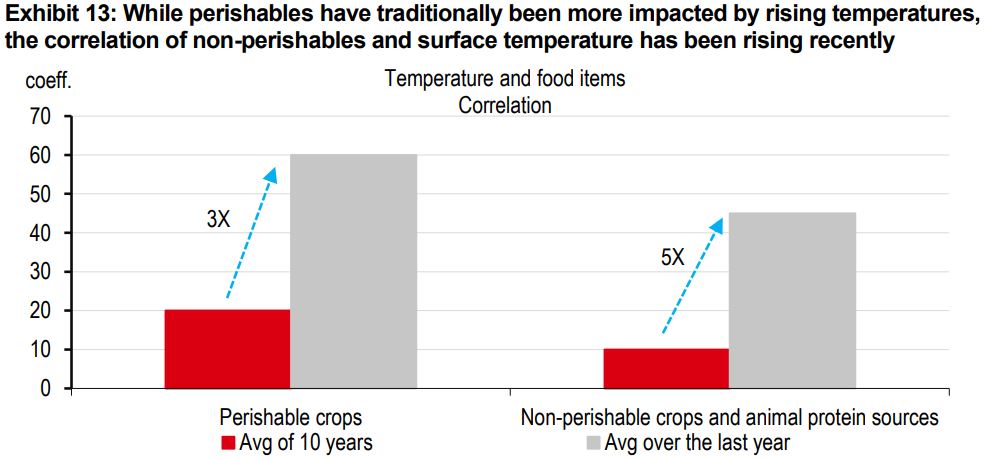
Most perishable crops are short-cycle crops (e.g. vegetables, where a new crop can be harvested every 2-3 months). These crops have traditionally been more sensitive to heatwaves than others, and this sensitivity is rising. We find the average correlation between temperature and price for the perishables to have risen from 20% (average of 10 years) to 60% (average over the last year), marking a 3-fold increase (see exhibit 13).
Correlation between surface temperature and prices of various food items
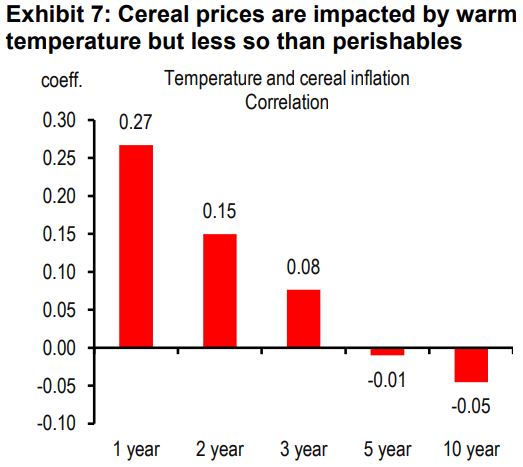
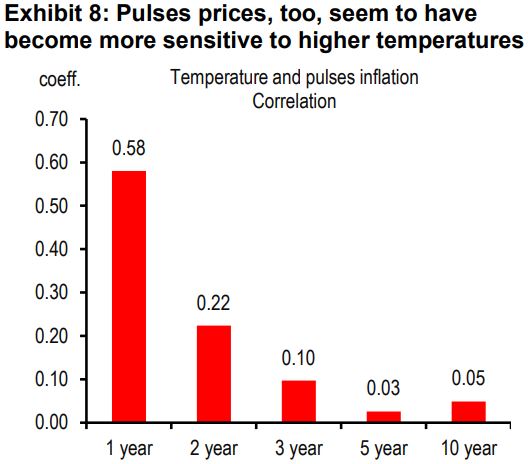
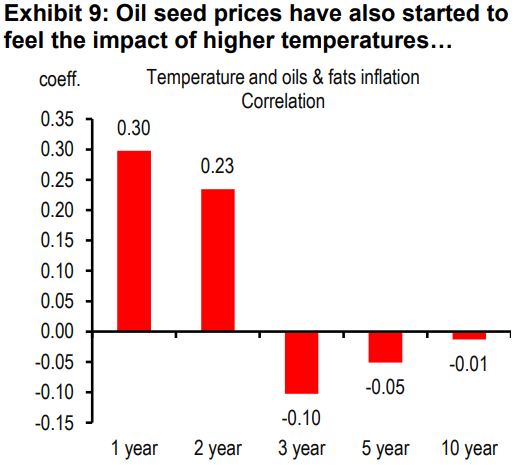
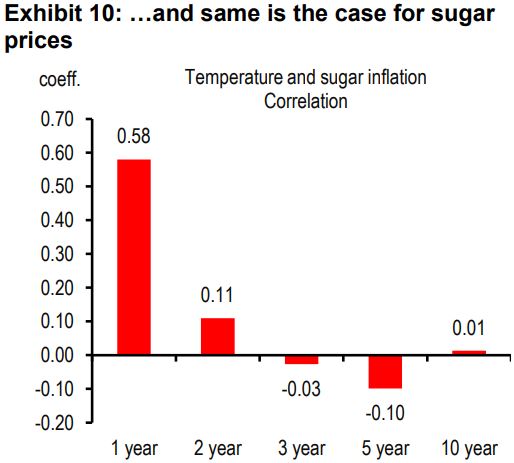
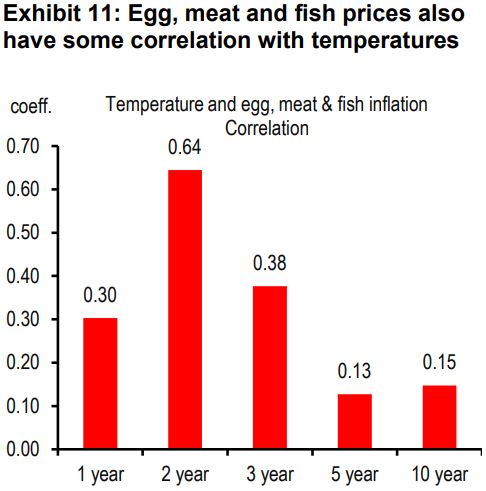
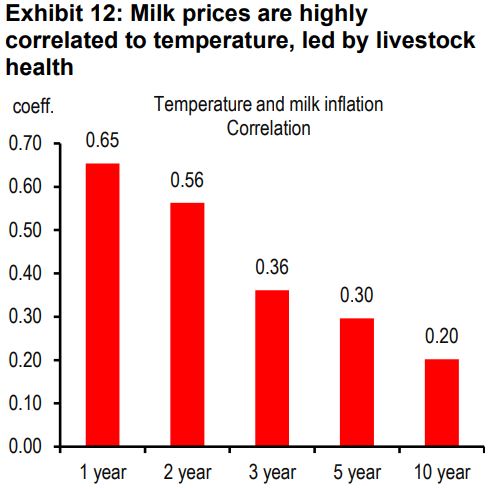
Durable crops are long-cycle crops (e.g. cereal, which are harvested every 6-12 months). Together with the animal protein sources, they have traditionally been less sensitive to temperatures, but sensitivity is growing, with the correlation rising from 10% (average of 10 years) to 45% (average over the last year), marking a 5-fold increase.
The rains versus temperature debate
This, then, brings us to another important question. If the sensitivity of food production and inflation to temperatures has risen over time, what role do rains and reservoirs play?
To answer this carefully, we get a little more technical than just running correlations. We bring out our trusted food inflation OLS model, which can help us parse the role of temperatures on food inflation better, while including other variables that also impact food inflation.
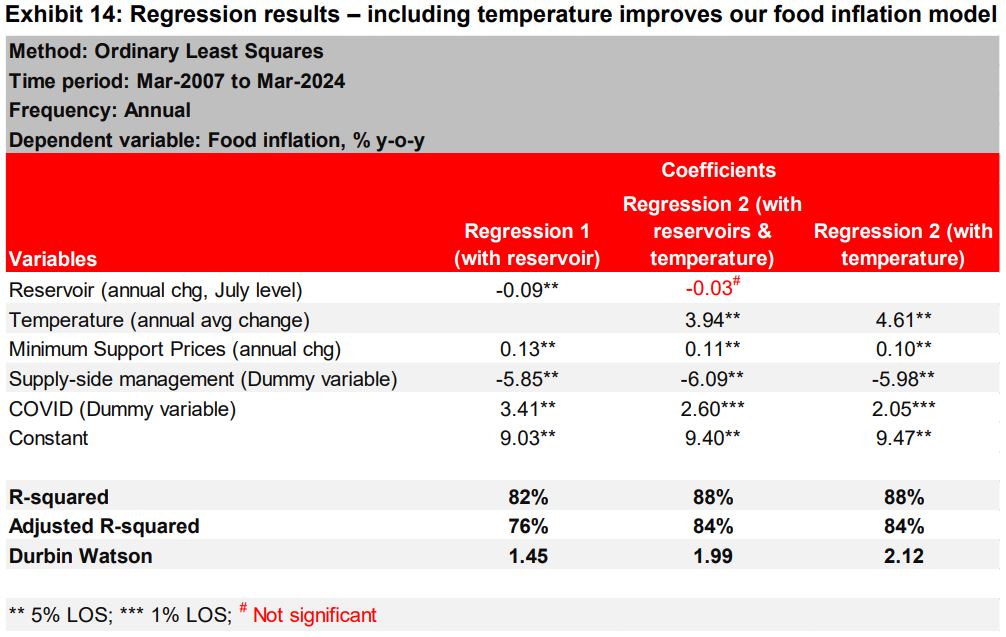
First, we re-run our old food inflation model for the 2007-2024 period (see regression 1 in exhibit 14). It includes:
- Reservoir levels – this variable picks up the y-o-y change in reservoir levels every June.
- The government’s minimum support prices for agriculture – this is based on agricultural input prices and a fixed mark up.
- Supply-side food price management steps – we find that nimble steps by the current government to buy-sell from government granaries, import-export, and quickly transport food items across the country have helped lower food inflation over the last decade. Clamping down on hoarders has helped too. We capture all of these supply-side management steps with a dummy which switches on in the last 10 years.
- Pandemic dummy – while farming activity was not directly hurt by the pandemic-related lockdowns (which were more applicable to urban areas), food trade and distribution were impacted. We capture this with a dummy that switches on in the pandemic years 2020-22.
Each of these variables is economically and statistically significant in explaining food inflation trends. The model has a strong R-squared of 82%.
Next, we include temperature in our model (see regression 2 in exhibit 14). And it doesn’t sit too comfortably with the other variables. The temperature variable is clearly statistically significant, but the reservoir variable turns insignificant. This could mean that temperature is crowding out the significance of reservoirs. Perhaps the temperature variable contains all the information which the rainfall variable holds, and more. Because, the fit of the model improves. R-squared increases from 82% to 88%.
Finally, we keep the temperature variable in the model but remove the reservoir variable (see regression 3 in exhibit 14). And this drastically improves our model. Each of the explanatory variables is economically and statistically significant. And the model’s R-squared is at an elevated 88%.
What’s really changed?
Temperatures are far superior than rainfall in explaining and forecasting food inflation. In fact, once temperatures are included, there is no value in analysing rains and reservoir levels.
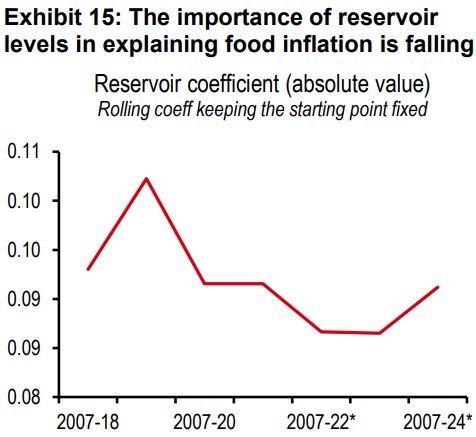
Indeed, over time, the coefficient of reservoir in our regression model has been falling, indicating than its importance has dwindled (see exhibit 15). There could be a couple of reasons for this.
One,with irrigation facilities improving over time, the low rains problem has been partly circumvented, especially in certain areas like north-western India (which is also known as the food bowl of the country).
Two, with reservoirs and temperatures having a 50% correlation, our sense is that a lot of the meaningful information contained in the reservoir variable gets picked up by temperatures.
Three, there is a non-linear relationship between temperatures and food inflation. As we saw above, with temperatures having crossed certain thresholds, the sensitivity of non-perishable food inflation to higher temperatures has grown even faster than for perishables (5x vs 3x over the last decade, though in level terms, the correlation is higher for perishables).
Normalising temperatures: Outlook for inflation and RBI action
The heatwave in March to May 2024 were characterised by temperatures which were, on average, 1.5-2 degrees Celsius higher than the previous year.
Since then, temperatures have normalised. The El Niño weather phenomenon from last year has made way for La Niña, associated with cooler temperatures and stronger precipitation.
Temperatures have fallen c0.5 degrees Celsius over the last month (compared to the Mar-Jun period). Applying our model coefficient, if this persists, food inflation could fall by 2ppt over the next few months, lowering headline inflation by 1ppt.
Headline inflation has averaged just below 5% so far in 2024. With normalising temperatures and falling food prices, it could fall to c4% by end-2024 (see exhibit 17). In fact, by March-2025, headline, core, and food inflation, are all likely to converge towards the 4% target.
Indeed, with temperatures cooling after a severe heatwave earlier this year, we expect the RBI to start easing rates in 4Q2024. We expect two 25bp repo rate cuts, taking the policy repo rate to 6% by March 2025.
While this is good news at a time when temperatures are normalising, it is worth keeping it in the back of our minds that over the medium term, rising temperatures could become a big problem for inflation management. The impact of weak rains can be managed by better irrigation facilities, but there is no magic wand to manage the impact of rising temperatures.
https://www.hsbc.com.my/wealth/insights/market-outlook/india-economics/2024-08/

