


like_count_tpl like_count_text_tpl
like_tooltip_tpl
comment_count_tpl comment_count_text_tpl
comment_tooltip_tpl
Economic Updates
India Economics: April PMI Flash’s intriguing rise

Key takeaways
- After dipping in March, PMI Flash ticked up in April, led by higher output, new orders, finished goods inventories, and jobs.
- Even our 100 indicators of growth database suggests manufacturing front-loading and inventory build-up, as firms hedge against the risk of energy input shortages.
- We expect the ongoing energy crisis to weigh on growth, but the full impact may only emerge after front-loading fades.
An unexpected rise
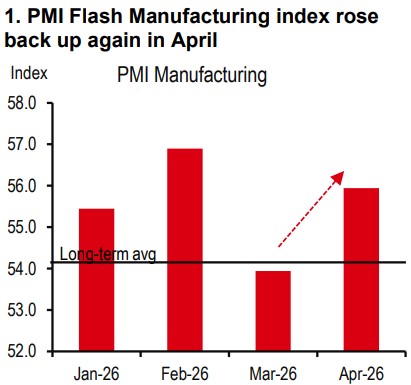
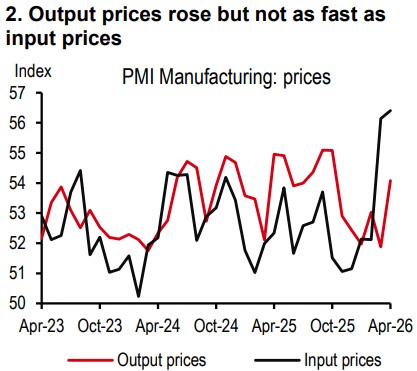
After dipping in March, the PMI Flash Manufacturing index rose again in April (from 53.9 to 55.9; see Exhibit 1). Input costs rose at the fastest pace in three years. Output prices picked up pace as well (although not as rapidly as input prices; see Exhibit 2). Survey respondents mentioned that gas shortages are pushing up prices.
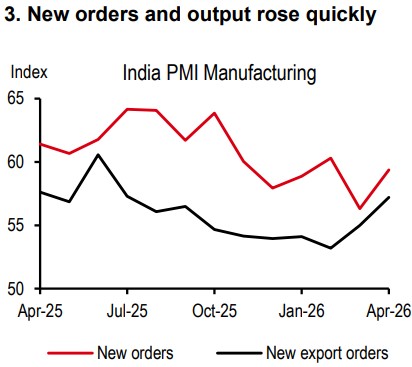
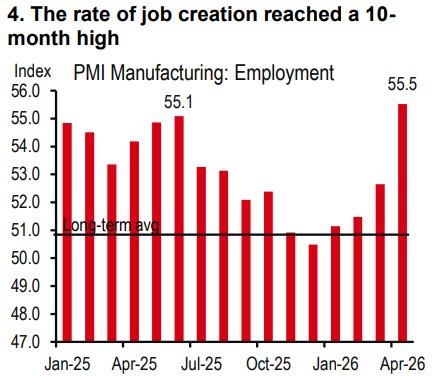
Yet, all of this did not hurt activity. New orders, output, and employment rose quickly. In fact, the rate of job creation reached a 10-month high (see Exhibit 3 and Exhibit 4).
The last time we had a major, though different, supply shock, was during the pandemic. PMI indices contracted over several months then. What caused this unexpected exuberance in April amid an energy crisis?
A case of front-loading production ...
Our sense is that it is a case of front-loading production. Consumers may want to purchase before retail prices are raised significantly, leading to a rise in new orders. The pump prices of petrol and diesel haven’t been raised yet, and this is protecting purchasing power.
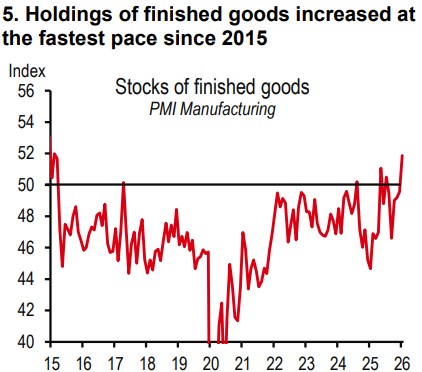
Meanwhile, manufacturers may want to build inventories before energy costs rise further. Indeed, input inventories picked up markedly. And holdings of finished goods increased for the first time in six months and at a quicker pace since 2015 (see Exhibit 5).
We see this more clearly now compared to previous episodes of oil price increases (eg, 2022). One reason could be that this time it is not just uncertainty around prices, but also availability of energy inputs. Manufacturers may want to produce and stock up before raw materials run out.
... with sectoral differences
Having said this, there are sectoral differences that must be noted.
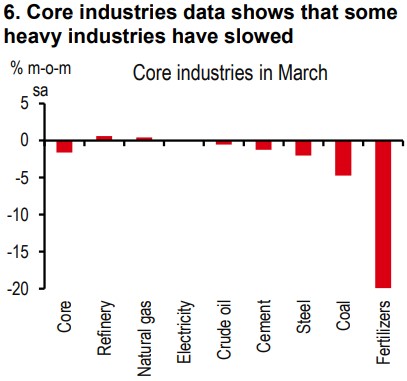
Heavy industry versus retail: The recently released core industries data shows that some heavy industries have slowed (see Exhibit 6). These include sectors like fertiliser that are dependent on natural gas, which is in short supply. Quota restrictions around the availability of gas have led to cuts in production. These sectors are not able to partake in production front-loading, as some retail-facing sectors are (continued overleaf).
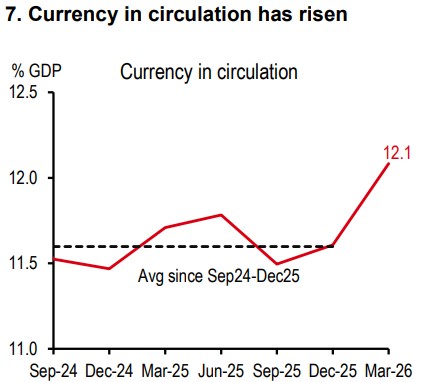
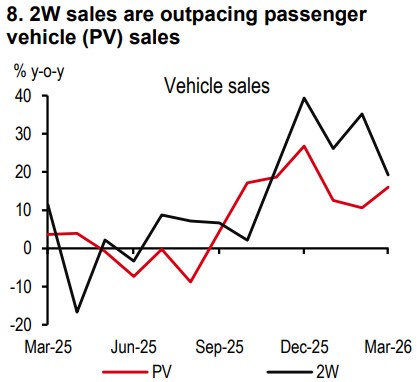
Rural versus urban: Some unrelated developments are also driving new orders. For instance, rural demand is strong on the back of post-harvest incomes from the recently sold winter crop. We see a reflection of this in the spike in currency in circulation and two-wheeler sales (both indicators of rural demand; see Exhibit 7 and Exhibit 8).
Formal versus informal: It is also possible that the formal sector is holding up better than the informal sector, as the former has more buffers and access to cheaper energy. Workers in the informal sector may not have the same social security and may be the first to reverse migrate to rural homes during shocks and shutdowns.
100 indicators of growth: Flavours and trajectory
We believe the growth shock from the energy crisis will be meaningful as it is not just a price shock, but also an availability of energy issue. We forecast that if oil averages USD80/bbl (USD100/bbl) in FY27, GDP growth could come in at 6.3% (5.7%), lower than the Statistics Office’s 7.6% estimate for the previous year (see key forecasts below).
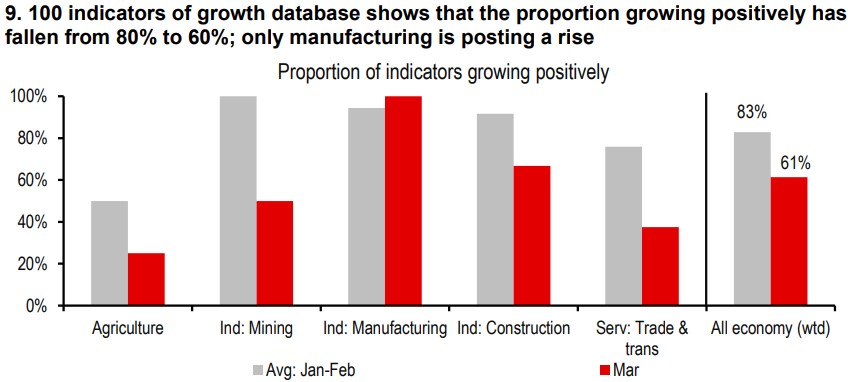
So far, our 100 indicators of growth database shows that, of the data available in March, the proportion growing positively has fallen from 80% to 60% (see Exhibit 9). Much of the fall is in agriculture (which includes fertiliser production), mining (which requires some gas derivatives), and construction (some steel plants are powered by natural gas). Interestingly, overall manufacturing is the only sector continuing to improve, in line with the April Flash PMI and GST revenues for the month.
All said, the growth drag can’t be escaped, even though it may show up fully in later quarters, especially when front-loading ends. It will be a tough balancing act for the Reserve Bank of India (RBI) to address rising inflation and slowing growth. We believe the bar for rate hikes is not very low. If oil prices average USD80/bbl in FY27 (and there is a moderate El Niño), inflation will likely remain below the 6% upper bound, and the RBI may not hike rates. However, if average oil prices cross USD100/bbl in FY27, inflation will likely cross 6%, and rate hikes may be in order.
https://www.hsbc.com.my/wealth/insights/market-outlook/india-economics/april-pmi-flash-s-intriguing-rise/

