


like_count_tpl like_count_text_tpl
like_tooltip_tpl
comment_count_tpl comment_count_text_tpl
comment_tooltip_tpl
Economic Updates
India Economics: Why RBI may need a thermometer

Key takeaways
- Average temperatures and food price sensitivity to heat are rising; temperature is outperforming rains in forecasting inflation.
- In El Niño years specifically, temperature spikes have become more likely than rainfall deficit; and these spikes are intensifying.
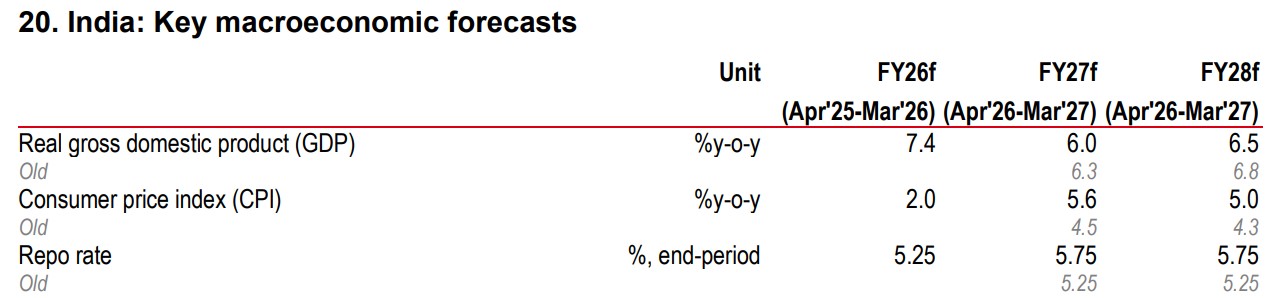
- With twin energy and El Niño shocks, we forecast FY27 inflation at 5.6%, GDP at 6%, and two rate hikes over 4Q26 and 1Q27, taking the repo rate to 5.75% (earlier: hold).
A couple of years ago, we pointed out that reservoir levels matter more than rains for India’s food production and inflation. More recently, we took our next leap—from rains and reservoirs, to temperatures. With global warming, average temperatures are rising and have crossed previous thresholds. They now impact food output and inflation much more than even rains and reservoirs do. In fact, tracking surface temperature is enough to get a good sense of where food inflation is headed.
This matters a lot more in a likely El Niño year. We find that the probability of high temperatures is stronger than the probability of low rains, and the quantum of rise in temperatures during El Niño years is rising. No crop escapes. Perishables like vegetables and fruits are traditionally more sensitive to heatwaves, and this sensitivity is rising. Durable crops like cereals, pulses, oilseeds and sugar are not too far behind as old temperature thresholds are breached. Even animal protein sources are becoming more sensitive to heat.
So what role do rains and reservoirs still play? We test this using our trusted food inflation model. When we include temperatures, reservoir levels lose importance—they get “crowded out”. Keeping temperatures but excluding rains/reservoirs improves the model’s ability to predict food inflation. The message is clear. Temperatures have become far better than rainfall in explaining and forecasting food inflation. Possible reasons: irrigation has improved, reservoir levels and temperatures have a 50% correlation (so information in the reservoir variable gets picked up by temperature), and the relationship between temperatures and inflation is non-linear—as old thresholds are breached, even durable food inflation is affected.
With the energy and El Niño shocks coinciding, the FY27 outlook needs attention. Our model suggests the El Niño/temperature channel can add 0.5ppt to inflation over a year. Adding this to our estimates from the energy shock (including local pump price increases), we expect headline inflation to average 5.6% in FY27. On this basis, we expect the RBI to deliver two rate hikes, over 4Q26 and 1Q27, taking the repo rate to 5.75%.
The accompanying growth shock will likely stop it from hiking a lot more. Bringing together both the shocks, and factoring in some fiscal slippage, we forecast GDP to grow 6% in FY27, lower than our previous year’s forecast of 7.4%. We expect the brunt of the shock to be felt by the informal sector—rural households and small firms—marking a change in India’s drivers of growth.
Forget the raindrops…
We have been steadily refining our views on inflation drivers over the last decade. And our latest findings suggest that it’s time to get prepared for rising inflation.
A couple of years ago, we pointed out that reservoir levels matter more than rains for India’s food production and inflation (as they capture underground water as well). Later we pointed out that trends in reservoir levels have been changing too.
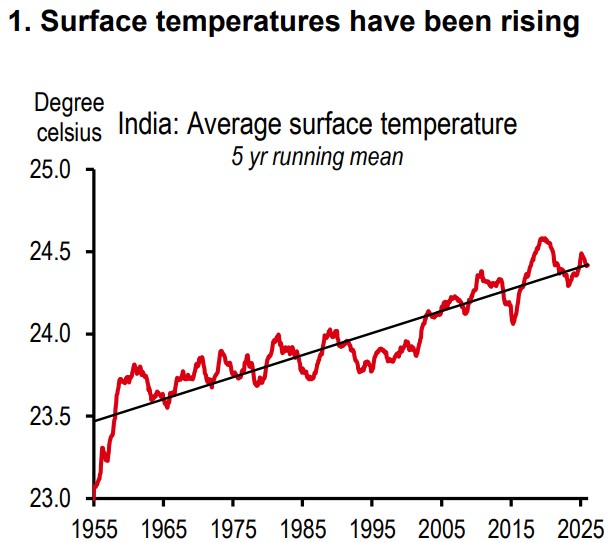
More recently, we took our next leap, from rains and reservoirs to temperatures. With global warming, average temperatures have crossed previous thresholds (see exhibit 1). They now impact food output and inflation much more than even rains and reservoirs do. In fact, we find that tracking surface temperature is enough to get a good sense of where food inflation is headed. We don’t even need to track rains in most parts (details later)!
In this report, we extend our work on surface temperatures mattering more than before. We analyse what it means for a year when the chances of an El Niño developing around mid-year are high.
As is well known, an El Niño is associated with low rains, high temperatures, higher food inflation, and lower growth. We go episode-by-episode, and crop-by-crop, and we think the results are too significant to ignore.
…bring out your thermometers
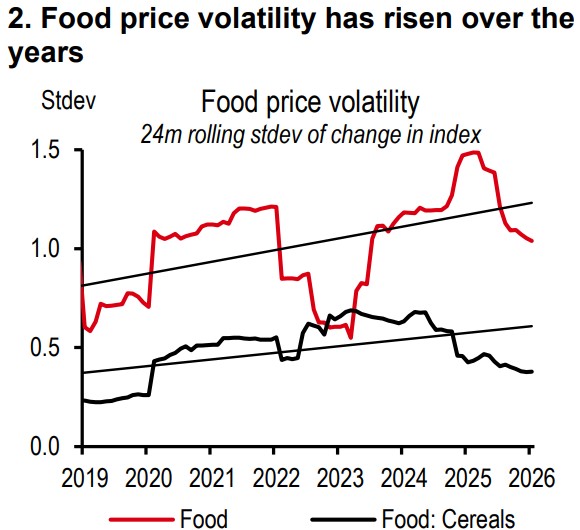
We have an extensive database of average surface temperatures across India since the 1950s, which shows that surface temperatures have been rising over time, as is the volatility in food prices (see exhibits 1 and 2). Indeed, there is growing evidence now that heatwaves in India are starting earlier, lasting longer, and becoming more intense.
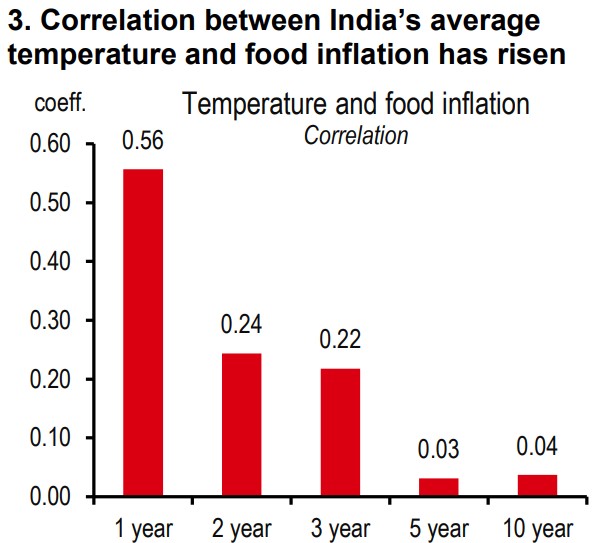
What we find next is that the correlation between average temperature and India’s food inflation has been rising consistently over time (see exhibit 3). As the earth is heating up, crop yields are falling.
Some of this is fresh in memory. The heatwave of March 2022 lowered the sugar cane crop yield by 30%, while hurting the production of vegetables, as well as oilseeds. In the heatwave of March 2024, temperatures rose to 50.5 degrees Celsius in some areas, leading to heat stress. The sharp rise in vegetable prices was a reflection of the crop damage.
Enter El Niño
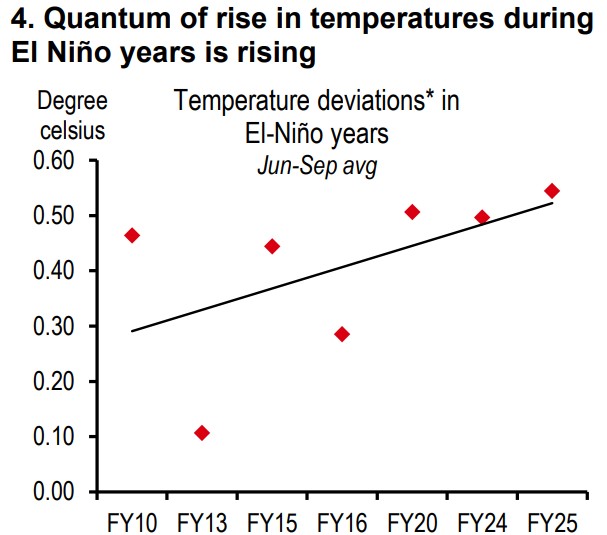
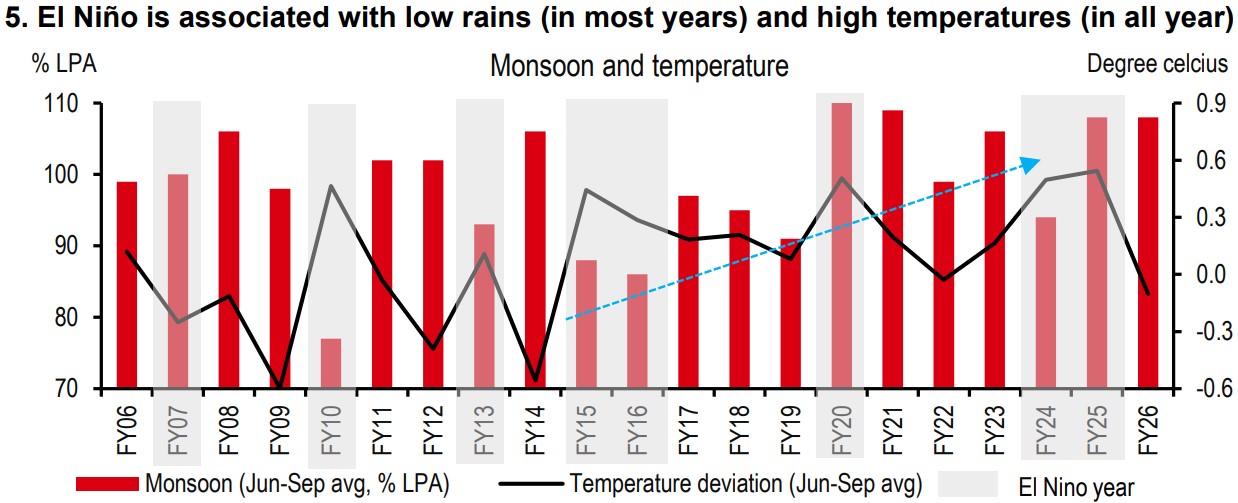
All this matters a lot more in an El Niño year. Just to recall, an El Niño is associated with low rains and high temperatures (see exhibit 4). But beyond the headline, there are some lesserknown consequences of El Niño in India.
One, the probability of high temperatures is stronger than the probability of low rains. For instance, in the FY20 and FY25 El Niño years, rains were strong despite being an El Niño year. But for both these years, temperatures shot up compared to the normal.
Two, the quantum of rise in temperatures during El Niño years is rising (see exhibit 5).
And this is where the worry lies – the impact of surface temperature on food inflation is rising, surface temperatures are rising too, El Niño is associated with higher-than-normal temperatures, and the quantum of spike in temperature in El Niño years is also on the rise.
No crop escapes
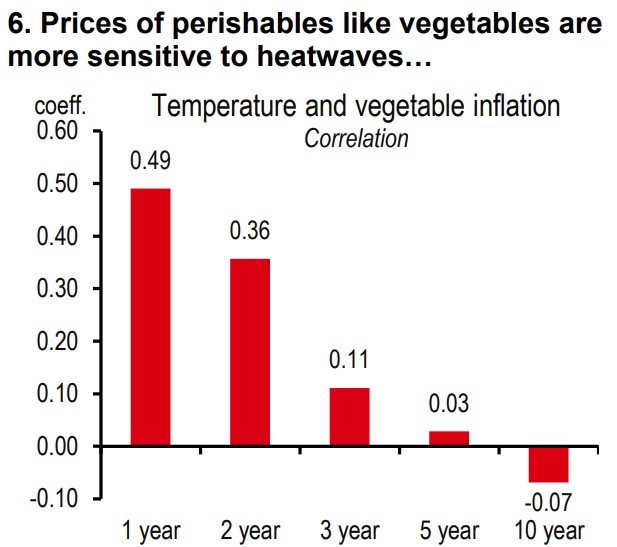
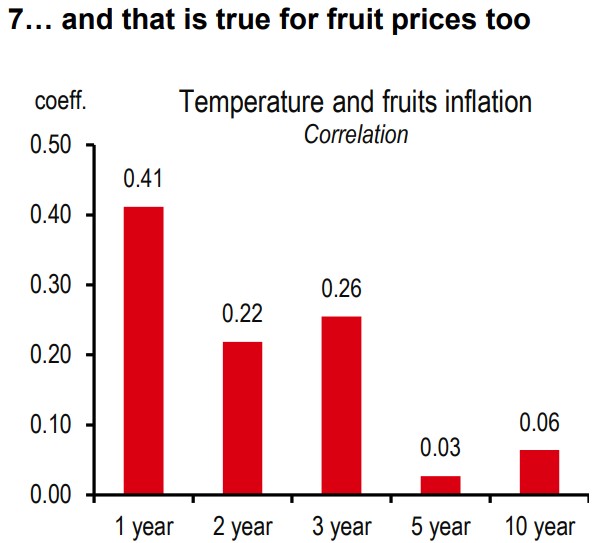
Analysing a decade of data, we find the correlation between average temperature and food inflation has been rising across all the main crops. Perishable crops like vegetables and fruits have traditionally been more sensitive to heatwaves than others, and this sensitivity is rising (see exhibits 6-7).
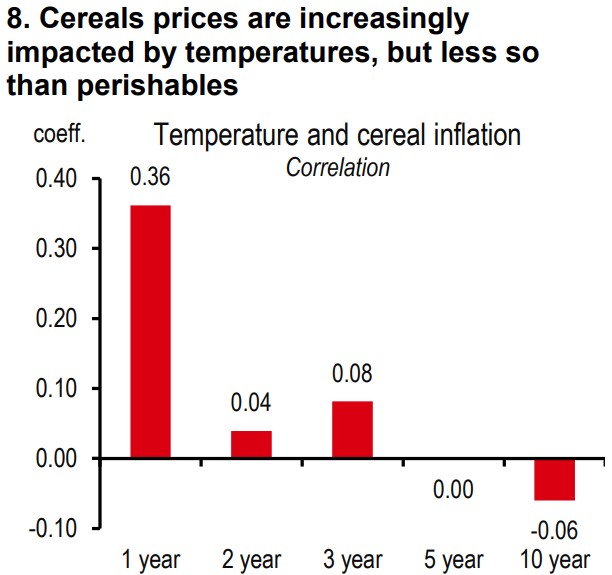
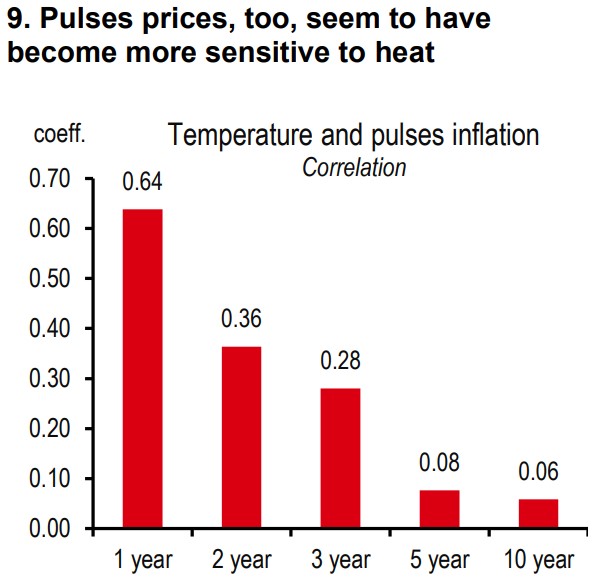
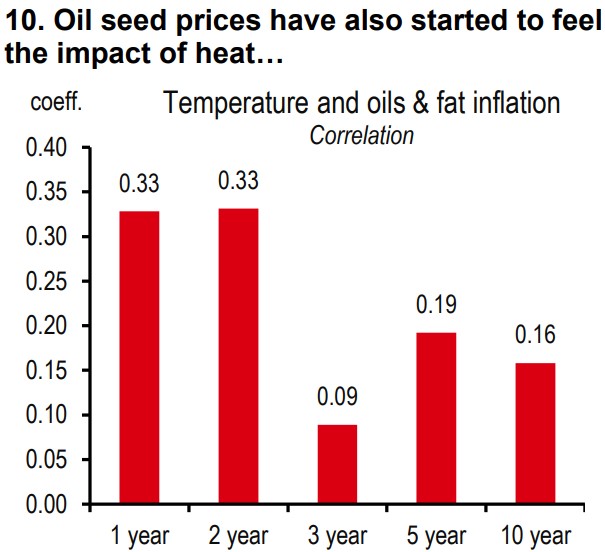
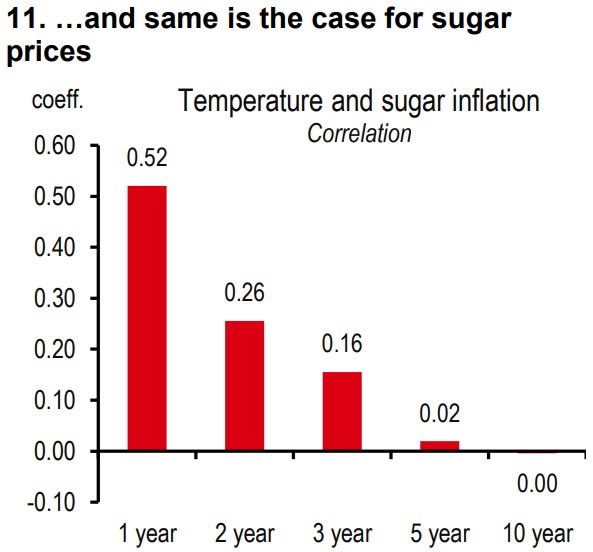
Durable crops like cereal, pulses, oilseeds and sugar are not too far behind. True that they have traditionally been less sensitive to heat, but the sensitivity is rising, as old temperature thresholds are being breached (see exhibits 8-11).
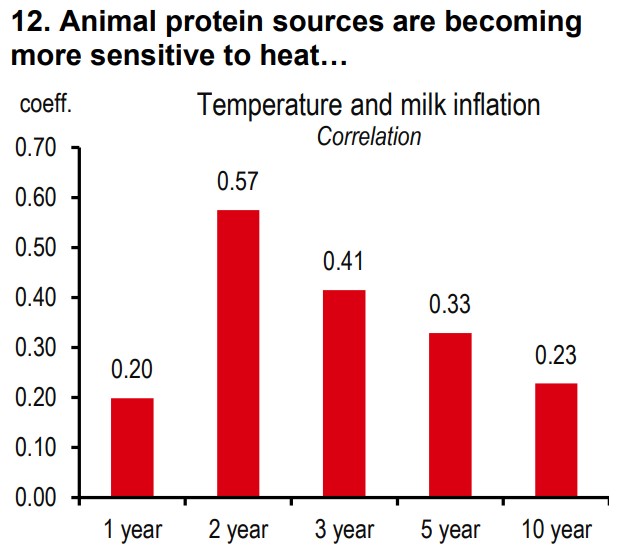
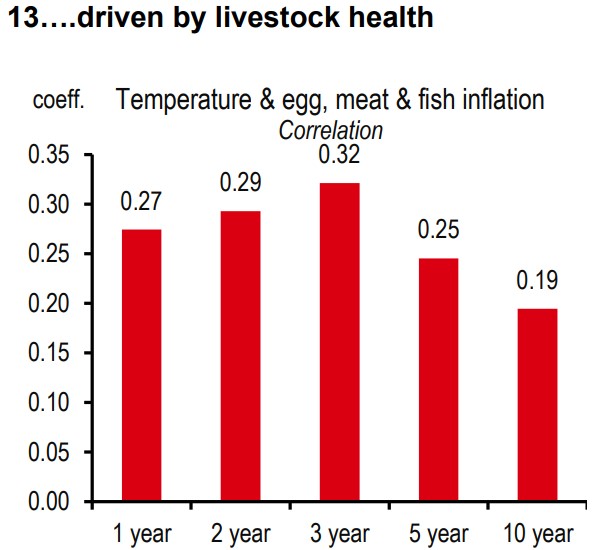
Even the price of dairy, poultry and fishery products, which we, on aggregate, call animal protein sources of food, are becoming increasingly more sensitive to rising temperatures (see exhibits 12-13).
The rains versus temperature debate
This, then, brings us to another important question. If the sensitivity of food production and inflation to temperatures has risen over time, what role do rains and reservoirs play?
To answer this carefully, we get a little more technical than just running correlations. We bring out our trusted food inflation OLS model, which can help us parse the role of temperatures on food inflation better, while including other variables that also impact food inflation.
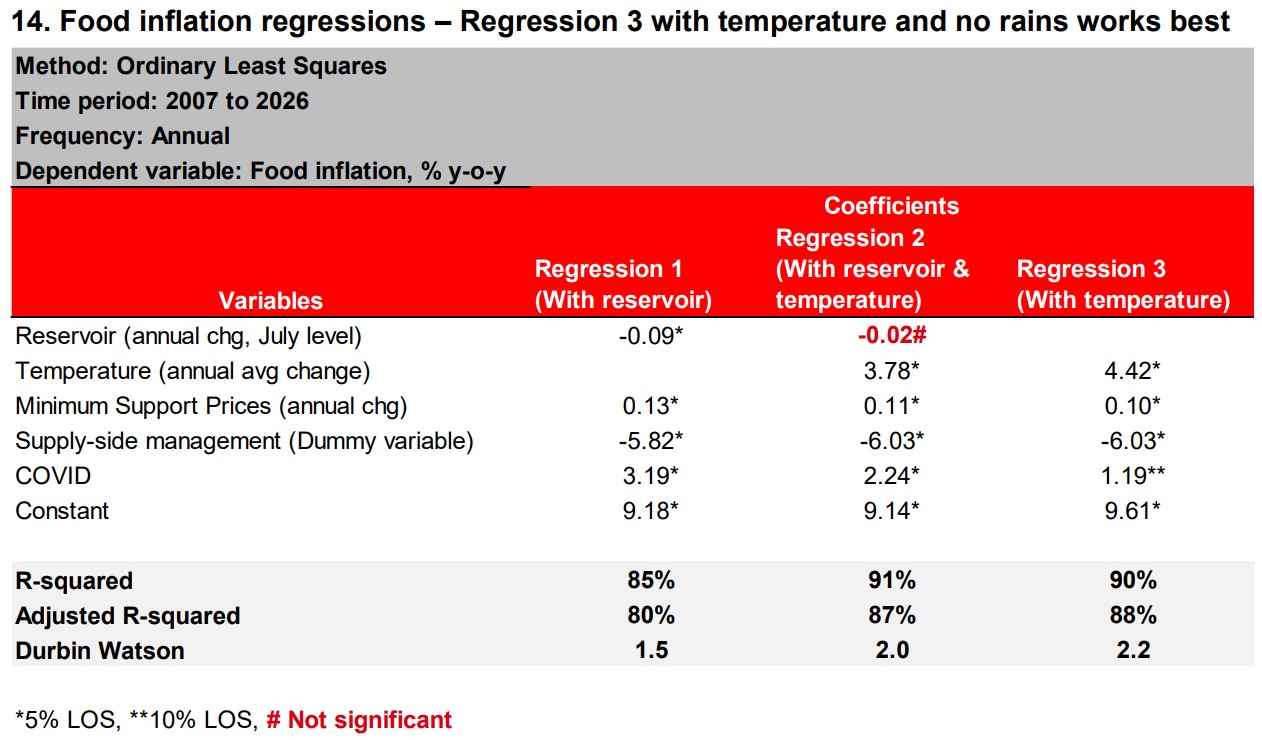
First, we re-run our old food inflation model for the 2007-2026 period (see regression 1 in exhibit 14). It includes reservoir levels, the government’s minimum support prices for agriculture, and dummy variables for the government’s food supply-side management steps to lower inflation, and the pandemic period.
Each of these variables is economically and statistically significant in explaining food inflation trends. The model has a strong R-squared of 85%.
Next, we include temperature in our model (see regression 2 in exhibit 14). And it doesn’t sit too comfortably with the other variables. The temperature variable is clearly statistically significant, but the reservoir variable turns insignificant.
This could mean that temperature is crowding out the significance of reservoirs. Perhaps the temperature variable contains all the information which the rainfall variable holds, and more. Because, the fit of the model improves. R-squared increases from 85% to 90%.
Finally, we keep the temperature variable in the model but remove the reservoir variable (see regression 3 in exhibit 14). And this drastically improves our model. Each of the explanatory variables is economically and statistically significant. And the model’s R-squared is at an elevated 90%.
What’s lowered the importance of rains?
Temperatures are far superior than rainfall in explaining and forecasting food inflation. In fact, once temperatures are included, there is no value in analysing rains and reservoir levels. Indeed, over time, the coefficient of reservoir in our regression model has been falling, indicating than its importance has dwindled. There could be several reasons for this:
- With irrigation facilities improving over time, the low rains problem has been partly circumvented, especially in certain areas like north-western India.
- With reservoirs and temperatures having a 50% correlation, our sense is that a lot of the meaningful information contained in the reservoir variable gets picked up by temperatures.
- There is a non-linear relationship between temperatures and food inflation. With temperatures having crossed certain thresholds, the sensitivity of non-perishable food inflation to heat has risen.
Outlook for FY27: Inflation and RBI action
It’s a season of overlapping shocks – energy, industrial feeds, and a likely El Niño.
Quantifying the El Niño shock: Our food inflation model (regression 3 in exhibit 14) quantifies the impact of rising temperatures on food inflation. If the rise in temperature is in line with the last 10-year average, we calculate that inflation could be 0.5ppt higher over a year from the onset of the El Niño. If the El Niño sets in later in 2026, then much of the impact could be felt in 2027. There are two-way risks to our estimate here. A severe El Niño would mean a sharper rise in prices. On the other hand, full up granaries could help ease some of the inflationary pressures.
Quantifying the energy shock: In a recent report, we did a detailed analysis of the impact of the energy shock on headline inflation by bringing together domestic pump prices, brent prices, and agricultural and industrial input prices across several oil price scenarios.
We assumed a rise in pump petrol and diesel prices by around INR6-7/litre. We also found that the inflation passthrough due to FX depreciation can be broadly offset by an emerging output gap. Bringing it all together, we estimated that if oil averages USD95/bbl in FY27, inflation could rise by 1.3ppt.
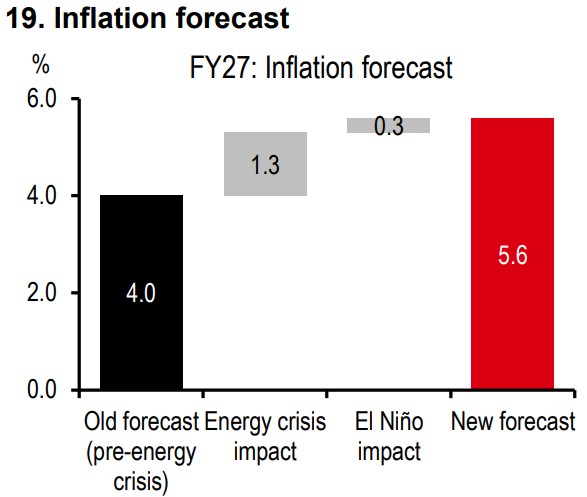
At the start of the year, our inflation forecast for FY27 was 4%. The two shocks can raise it to 5.6%. We also believe that some of the El Niño pressure could be felt in the winter crop, keeping inflation elevated in the first half of FY28. Depending on when the El Niño sets in, inflation could be higher than 6% for 2-3 quarters as per our forecasts (see exhibit 15).
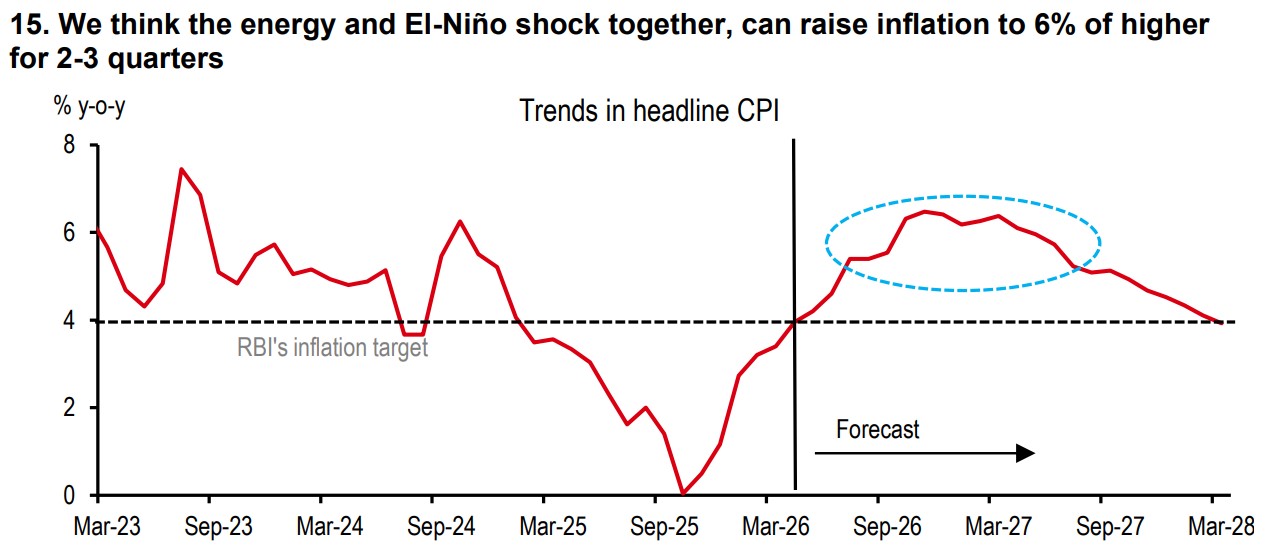
We have assumed a INR6-7/litre rise in petrol and diesel prices in our forecast, as we believe that will address the pain felt by oil PSUs. If that rise were not to happen, average inflation would be closer to 5.3% for FY27. But inflation would still cross 6% for a 2-3 quarter period.
On the back of our forecast that inflation will rise to 6% or higher for 2-3 quarters between Sep 2026 and Sep 2027, led by higher oil prices and the impact of rising temperatures in the El Niño, we are now forecasting two repo rate hikes over 4Q 2026 and 1Q2027, taking the repo rate to 5.75% (versus previous forecast of no change in rates).
We are not forecasting an immediate rate hike in the upcoming June meeting, because the government is running welfare schemes at a time when the energy crisis is in full swing. The RBI may also want to remain growth supportive. Instead we expect the hikes to begin when we are over the peak of the energy crisis.
We are not forecasting a bigger rate hike than 50bp for now because (1) we believe the RBI will look through part of the inflation increase as temporary (given we forecast CPI inflation to asymptote towards 4% by March 2028), and (2) we believe growth will also fall meaningfully due to the twin shocks, and the RBI may have to be mindful of that.
Outlook for FY27: Growth and government action
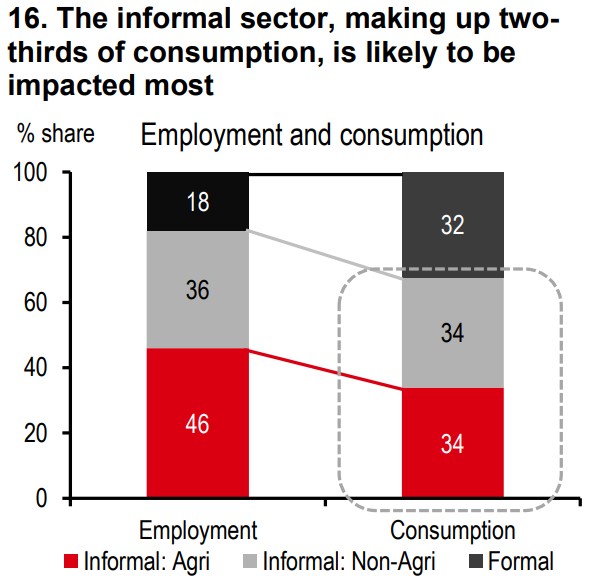
The twin shock is likely to take a toll on growth too. We believe the informal sector, comprising rural workers and urban informal workers (for instance those working in MSMEs) get impacted most during supply shocks. Heatwaves will impact farmers directly, and high energy inflation will likely impact both the rural and urban informal workers, who, together make up two-thirds of consumption (see exhibit 16).
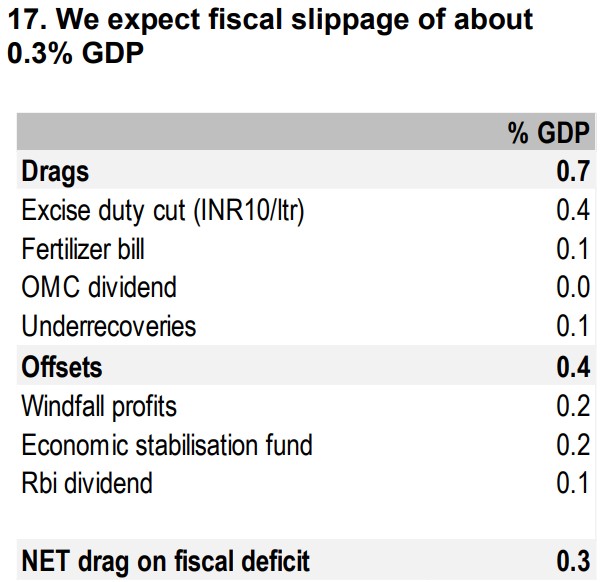
We estimate that the price and quantity disruptions in energy sources can shave off around 1ppt from growth. An El Niño could shave off a further 0.3ppt from growth. The government will likely step in to support growth with credit guarantee schemes, rural unemployment benefits, and public capex. We expect a fiscal slippage by about 0.3% of GDP (see exhibit 17).
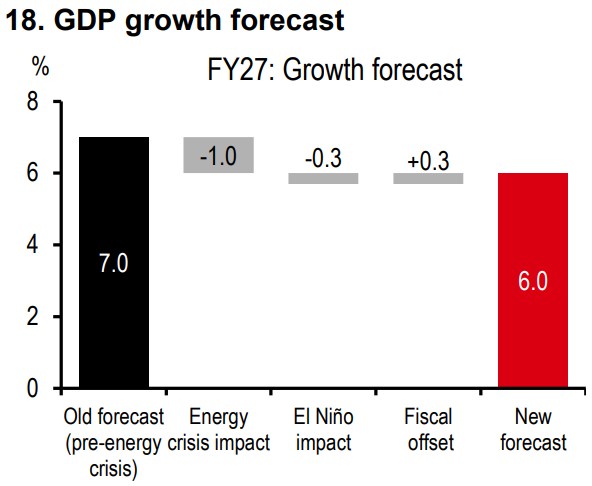
Overall, we forecast GDP growth to average 6% in FY27 (versus an estimated 7.4% in FY26, see exhibit 18) and inflation to average 5.6% in FY27 (versus 2% a year ago).
https://www.hsbc.com.my/wealth/insights/market-outlook/india-economics/why-rbi-may-need-a-thermometer/

