



like_count_tpl like_count_text_tpl
like_tooltip_tpl
comment_count_tpl comment_count_text_tpl
comment_tooltip_tpl
Economic Updates
India Economics: Inflation, external trade, and rates

Key takeaways
- Services inflation remains unusually subdued keeping the headline low, even as goods inflation has taken off.
- Services exports are containing external imbalances despite a sharp rise in goods imports; growth, too, may become more services-led.
- If these services buffers weaken, the case for rate hikes will only strengthen; we continue to expect two hikes in FY27.
India’s headline macro picture seems to have shrugged off the energy crisis. Growth remains high, inflation remains low, and the current account (c/a) deficit surprisingly contained. But we argue in this report that this is largely because India is being “saved by services”. And that’s where some key risks now sit.
On growth, tailwinds from GST cuts, front-loading of manufacturing, and the opening of an exports window (following tariff cuts) have kept growth strong. But with the risk of a post-front-loading lull and weaker agriculture (if El Niño strengthens), the services sector will increasingly determine where growth lands.
The bigger message, though, is risk. Services are currently acting as macro shock absorbers, and not letting strong growth spill over into inflation and external balances. What if those buffers weaken?
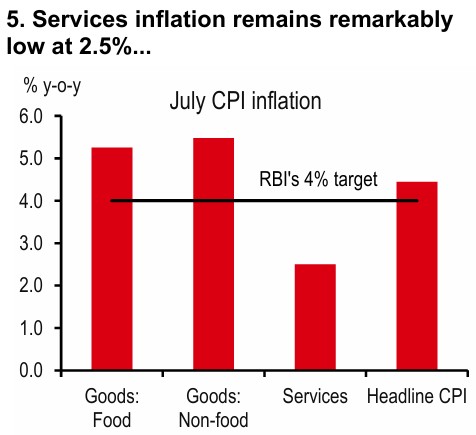
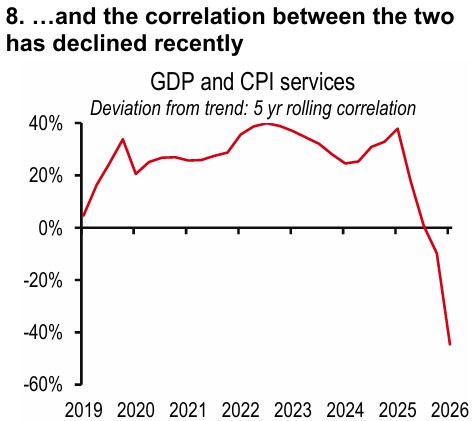
Headline inflation is “well behaved” at 4.4% in July, close to the RBI’s 4% target, despite strong activity, a 15% real exchange rate depreciation, and higher commodities. Underneath, however, goods inflation is already averaging 5.4%, and could rise further. The reason headline inflation stays contained is that services inflation is at just 2.5%. But this rather low number does not meet our smell test. The strong correlation between growth and service inflation has broken recently in the data. If it normalises, headline CPI could rise.
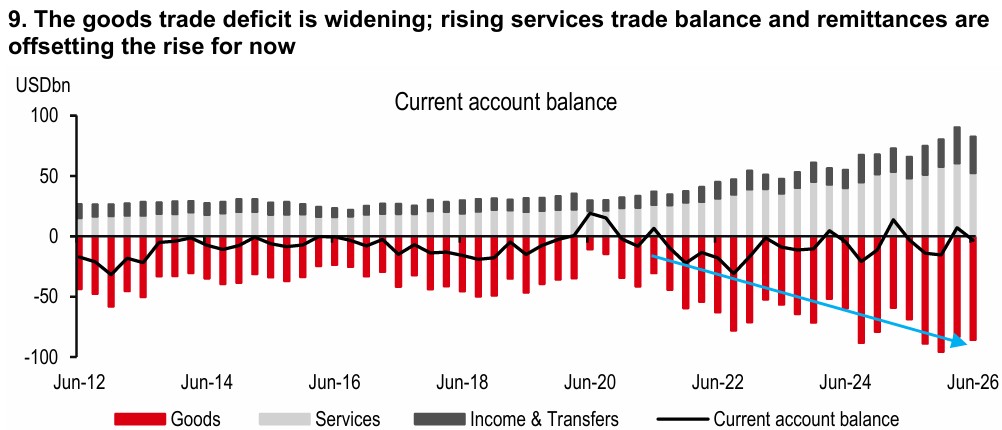
External balances tell a similar story. The headline c/a deficit is only 0.3% of GDP in the June quarter, but within it, the goods trade deficit is widening quickly. Interestingly, it is not as much led by oil and gold, as it is led by higher electronics and other core imports. For now, rising services exports is offsetting this rise. Yet services exports have already grown at a softer pace, and AI-related uncertainty is an added risk. How long can it offset a rising goods deficit?
The risk assessment is sharpened by a tougher global backdrop (high oil, elevated global yields) and changes in India’s flows picture once the subsidised foreign currency non-resident (FCNR), external commercial borrowing (ECB) and bank borrowing window closes. Against this backdrop, if services inflation rises and/or services exports weaken, rate hikes may become the much needed “bitter pill” to cool demand that is feeding goods inflation and strong core imports. The RBI explicitly flagged persistence and pass-through risks in the just-released RBI Minutes. Our forecast remains two hikes in FY27, taking the repo rate to 5.75%.
Energy shock? Where?
Oil prices have stayed high for much of this year. But we can’t really see that in India’s macroeconomic numbers. Growth remains high, inflation remains low, and the c/a deficit surprisingly contained. Headline numbers across the board feel more goldilocks than crisis.
But we want to dig deeper here. What’s making everything look rosy? Where do the key risks lie? We ask three questions, pertaining to growth, inflation, and trade balances. And we find some new and unexpected answers.
Let’s start.
How strong is growth?
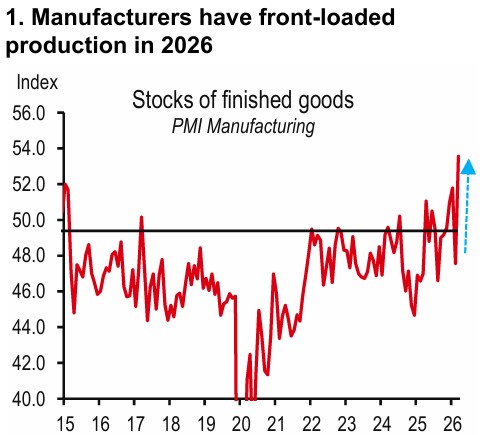
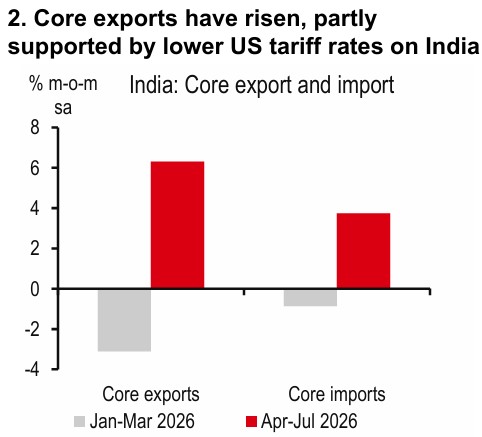
Growth prints have been remarkably strong. We believe the positive tailwinds from both fiscal and monetary policy easing have helped tremendously. Recall the 125bp repo rate cut, liquidity turning to surplus, and the GST tax rate cuts of 2025. In addition, there was help available from the front loading of manufacturing by producers nervous about energy availability down the line (see exhibit 1), and a sharp rise in core exports (following the rapid fall in the US tariffs imposed on India, see exhibit 2).
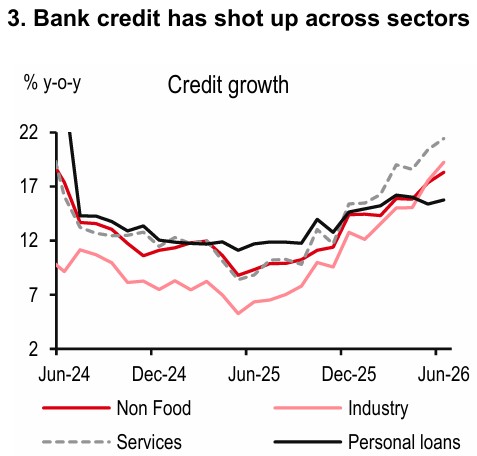
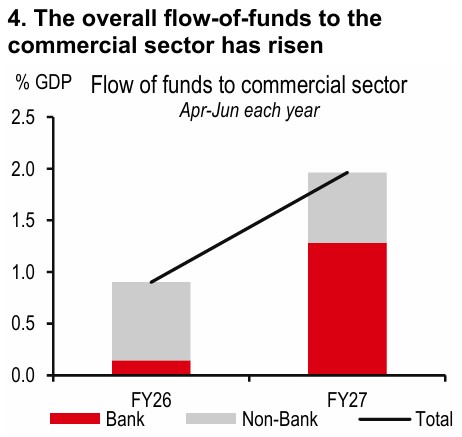
Bank credit growth shot up across sectors (see exhibit 3). And it wasn’t just a case of substitution from non-bank to bank sources of funding (especially for NBFCs). Alongside some substitution, the overall flow-of-funds to the commercial sector showed a big rise (see exhibit 4). In fact, our 100-indicators of growth database points towards a GDP print of 7-7.5% for the June quarter, which was at the heart of the energy crisis (following 7.8% in the previous quarter).
But like for every other data source in India, holes can be poked. It can be argued that a lot of the credit growth was driven by factors such as the new government credit guarantee scheme for small firms, the rise in working capital needs spurred by higher commodity prices, and the proliferation of gold loan growth (which can sometimes be seen as an indicator of stress).
More broadly, if frontloading of manufacturing has spurred growth, it can be followed by a lull. And agricultural growth could be weaker if the El Niño strengthens into year-end.
All said, it is worth asking whether growth will remain strong?
Our sense is that services growth, making up the remaining c55% of GDP, will determine growth dynamics to a large extent hereon. Rising banking sector liquidity tends to support financial services. Global Capability Centres have been a strong driver of software services. Oil prices matter for trade and transport services. And the government’s fiscal spending drives public services. How some of these perform may eventually determine whether growth remains strong.
But this is not the only reason we are discussing services. Their growing impact is not just on growth but also macro stability.
How low is inflation?
Strong growth should stoke inflation. But despite strong GDP prints, a 15% depreciation in the real exchange rate (since early 2025), and higher commodity prices, inflation remains well behaved at 4.4% in July (close to the RBI’s 4% inflation target).
We peel the onion and find some divergent trends. We carefully create a goods (c67% weight) and a service (c33% weight) series within CPI. Thereafter we break down the CPI basket into three broadly equally sized parts – food, non-food goods, and services.
And this is when divergences stare at us. Food and non-food goods inflation is already averaging 5.4% y-o-y in July. And given high WPI (9.8% in July) and output PPI inflation (9.6% in July) and their eventual pass-through to CPI, these numbers will likely rise from here.
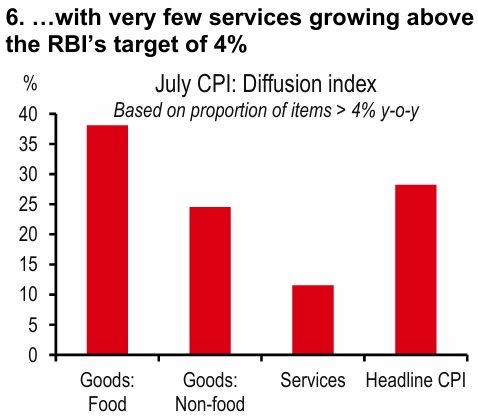
It’s services inflation that remains remarkably low at 2.5%, pulling the headline down to 4.4% (see exhibits 5 and 6). Though to be fair, it has risen by 0.5ppt in three months.
The problem here is that it is not very intuitive to us why services inflation is so low. Two points explain our concerns.
- When we moved from the old to the new CPI series, services inflation should have risen given free education and health services had been removed. Instead, services inflation fell (from 3.1% in December 2025 in the old series, to 1.9% in January 2026 in the new series).
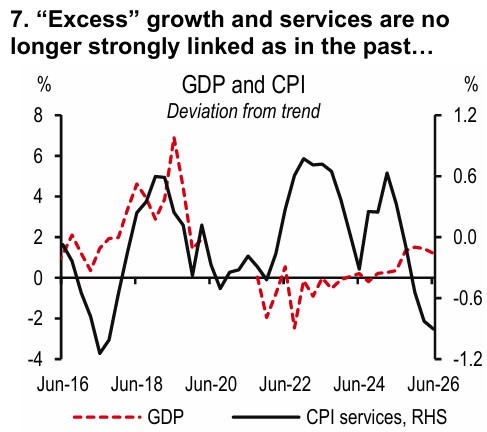
- Strong growth should stoke inflation, and particularly services inflation where price pressures can’t be imported away. But our analysis shows that “excess” growth and services are no longer strongly correlated as in the past (see exhibits 7 and 8). That relationship is broken.
And this, we believe, is the main risk to inflation. Low services inflation data is keeping headline contained. If it rises from here, reflecting growth better, headline inflation numbers could rise quickly.
How contained is the c/a deficit?
When growth is too strong, it tends to show up in macro stability indicators. As we saw above, its lack of presence in services inflation is intriguing (even though it has shown up clearly in CPI goods inflation). But is it showing up elsewhere, for instance in external balances?
We take a look at the c/a deficit in India and the headline message is similar to inflation. The headline c/a deficit is low at 0.3% of GDP as per RBI’s aggregated monthly data, and not showing signs of excesses.
Once again, we peel the onion and find that the details can’t be ignored.
True the c/a deficit is low, but within that, the goods trade deficit is only growing. Luckily, rising services exports and remittances are offsetting the rise, keeping the c/a deficit low (see exhibit 9).
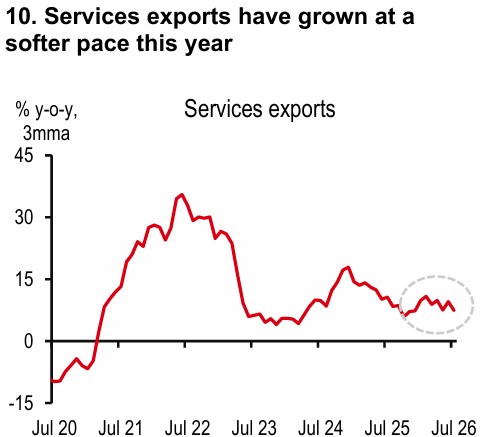
But given the uncertainties around the impact of AI on services exports growth, one needs to be careful on how long services can fund a rising goods deficit. Already, services exports have grown at a softer pace this year (see exhibit 10).
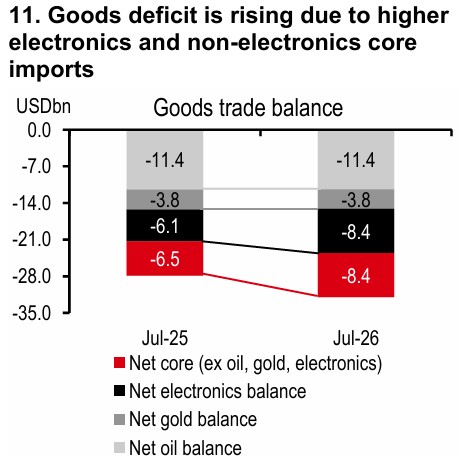
So we go back to the goods deficit to see what’s causing the continued rise. And we are in for a surprise. Compared to a year ago, the rise in the trade deficit is not caused by high oil and gold imports. Rather, it is caused by a higher core goods deficit. The electronics deficit has risen sharply, as has non-electronic core goods deficit (see exhibit 11).
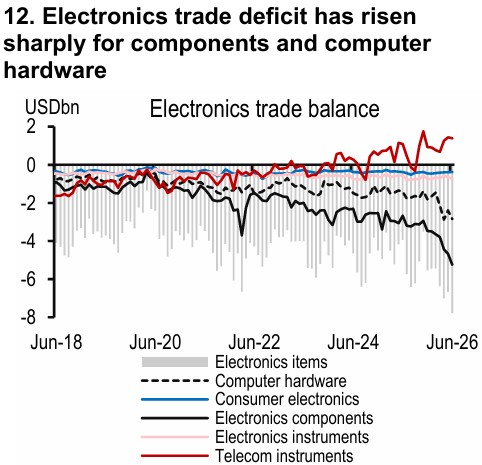
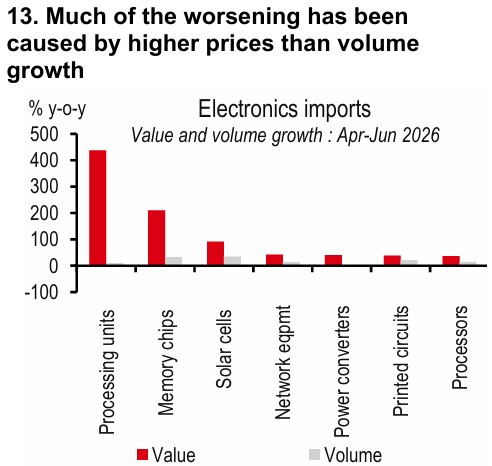
The electronic trade deficit has risen sharply for components and computer hardware, and not mobile phones (which is a growing surplus, see exhibit 12). And interestingly, much of the worsening has been caused by higher prices rather than higher volume growth (see exhibit 13). With strong global demand, this part of the deficit may not come down sharply too quickly.
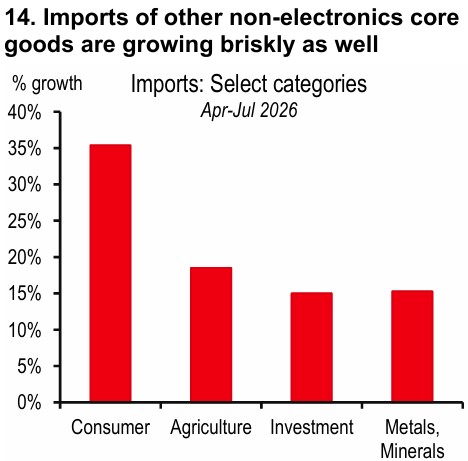
We go on to investigate non-electronics core goods deficit, and find that imports are rising at a fast pace across the board – consumption, investment, metals, and agricultural goods (see exhibit 14), reflective of strong domestic growth.
A new risk assessment
To summarise, the services sector plays a very important role in determining where growth will land, how long inflation will remain low, and till when will external deficits be contained.
Low services inflation and high services exports are keeping a lid on inflation and external imbalances, respectively. It will be important to keep an eye on these, if they turn.
All of this could become more important if the global environment remains tough for long – high oil prices and elevated global yields.
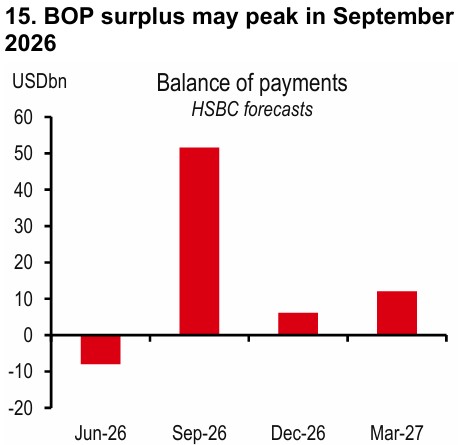
External imbalances are equally about capital inflows as they are about the c/a deficit. The strong flood of foreign inflows into India on the back of the FCNR scheme will also end by 31 August (recall that the scheme is now ending a month sooner than earlier announced by the RBI). And other subsidised windows for ECB and foreign bank borrowing will also close by end December 2026. This means that even though spot FX reserves have gone back up, and the full-year BoP surplus is significant, when we divide it up by quarters, it may show a lower surplus following the September highs (see exhibit 15).
If risks (such as higher services inflation and lower services exports) do materialize in this backdrop, it may make interest rate increases an important ‘bitter pill’ which policymakers need to administer – to dampen the demand which is clearly stoking goods inflation and strong core goods imports. Early action would be important given transmission lags.
We think that the RBI had struck a dovish note in its 5 August policy meeting. But it sounded more neutral in its minutes released on 19 August. The governor said that “persistence of realised prints at these or higher levels”, and higher pass-through from food and fuel leading to “de-anchoring of expectations” could result in rate hikes. Deputy Governor Gupta called for waiting and watching some more for “weather-related uncertainties to fully settle”.
We have long maintained our view of two rate hikes in FY27, taking the repo rate to 5.75%, and our assessment of services sector-led risks and RBI minutes only make us more confident of our rate hiking view.
https://www.hsbc.com.my/wealth/insights/market-outlook/india-economics/inflation-external-trade-and-rates/

