2023-08-17 09:18
The Commerce Department reported a significant 0.7% surge in U.S. retail sales. Canada’s yearly inflation rate surged beyond expectations to 3.3% in July. There are increased expectations for a quarter-percentage-point BOC rate hike in September. Today’s USD/CAD forecast is slightly bearish. Although the dollar fell, it remained close to a one-month top hit on Monday. Following positive U.S. data, the recent dollar rally was attributed to elevated bond yields. The Commerce Department reported a significant 0.7% surge in U.S. retail sales last month. This showcased enduring demand despite the Fed’s aggressive interest rate increases designed to control inflation. The resilience in the economy is due to robust wage growth from a tight labor market. Elsewhere, Canada’s yearly inflation rate surged beyond expectations to 3.3% in July, as data revealed on Tuesday. The persistent elevation of core indicators scrutinized by the central bank heightens the probability of another interest rate hike. Meanwhile, analysts had predicted a rise in inflation to 3.0% from June’s 27-month low of 2.8%. According to Statistics Canada, the consumer price index marked a 0.6% increase on a monthly basis, surpassing the projected 0.3% uptick. Additionally, the average of two core measures of underlying inflation settled at 3.65%, compared to June’s 3.70%. After the inflation data release, the money markets saw increased expectations for a quarter-percentage-point rate hike in September. The probability surged from 22% to 35% immediately after the data’s release and later stabilized at a 31% chance. USD/CAD Key Events Today Data from the US that will likely move the pair today include the building permits report, and the US crude oil inventories report. Moreover, investors will focus on the FOMC meeting minutes. USD/CAD Technical Forecast: Bears Emerge As Price Encounters Resistance At 1.3500. USD/CAD 4-hour chart On the charts, USD/CAD has hit resistance at 1.3500, where bears have emerged. Still, the bias is bullish because the price is above the 30-SMA, while the RSI supports bullish momentum over 50. At the same time, there is a chance the trend will soon reverse as the RSI has made a bearish divergence with the price. This indicates waning enthusiasm to push the price higher. This divergence could also lead to a deep pullback to retest the 1.3400 support. https://www.forexcrunch.com/usd-cad-forecast-bulls-retained-at-1-35-focus-on-fomc/

2023-08-17 09:17
The bias remains bearish as long as it stays below the downtrend line. Only a valid breakout through the downtrend line validates a larger growth. The FOMC Meeting Minutes should bring sharp movements today. The gold price bounced back, trading at $1,905 at the time of writing. Greenback’s temporary retreat helped the yellow metal to rebound in the short term. Still, the bias remains bearish, so more declines are still possible. The USD’s rally could force the price of gold to drop again. Fundamentally, the US Retail Sales reported a 0.7% growth versus the 0.4% growth estimated, while Core Retail Sales increased by 1.0%, beating the 0.4% growth forecasted in the last trading session. Furthermore, the Canadian Consumer Price Index registered a 0.6% growth, beating the 0.3% growth expected. Today, the RBNZ left the monetary policy unchanged. The Official Cash Rate remained at 5.50% as forecasted, while the UK CPI and Core CPI reported higher-than-expected inflation. Later, the US will release the Industrial Production, Capacity Utilization Rate, Housing Starts, and Building Permits indicators that could come in better than the previous reporting period. Still, the FOMC Meeting Minutes is seen as the most important event. A hawkish report could boost the USD and push the XAU/USD down again. Gold Price Technical Analysis: Rebound in play Gold price hourly chart From the technical point of view, the price action developed a major Falling Wedge pattern which is still far from being confirmed. As long as it stays below the downtrend line, the price could drop again as the outlook is bearish. As you can see on the hourly chart, the XAU/USD found strong support on the downside line and the S1 (1,900). The yellow metal registered only false breakdowns signaling that the sell-off ended and buyers could take it higher. Still, only taking out the downtrend line should announce a larger rebound and could bring us new longs. https://www.forexcrunch.com/gold-price-to-break-falling-wedge-pattern-eying-fomc/

2023-08-17 09:16
Data revealed an unexpected decrease in Australia’s employment numbers for July. There’s speculation that the RBA might halt its interest rate hikes. There are divisions among Fed officials regarding the necessity of further rate hikes. Today’s AUD/USD forecast is bearish. The Australian dollar dropped to its lowest point in nine months, also pulling the New Zealand dollar down. This decline followed data release revealing an unexpected decrease in Australia’s employment numbers for July. Moreover, there was a rise in the jobless rate. This increase in the jobless rate suggests a possible loosening of the previously tight labor market. Furthermore, the surprising data sparked speculation that the Reserve Bank of Australia (RBA) might halt its interest rate hikes. Consequently, the local dollar fell to a nine-month low, reaching $0.6366. Figures given by the Australian Bureau of Statistics (ABS) on Thursday indicated a net loss of 14,600 jobs in July compared to June. This reversal contradicted market expectations of a 15,000 increase in jobs. Notably, all these job losses occurred in the full-time job sector, which experienced a drop of 24,200 positions. Moreover, the jobless rate increased from 3.5% to 3.7%, exceeding analysts’ forecasts of 3.6% and marking the highest rate since April. Nonetheless, at first glance, the report seemed to align with the RBA’s argument for a potential “turning point” in the market. This shift could help alleviate inflationary pressures. The central bank has already put its rate hikes on hold for the past two months, and investors speculate that the tightening cycle might be ending. Futures markets suggest only a 50-50 chance of one more quarter-point rate hike to reach 4.35% by year-end. Elsewhere, minutes from the Fed’s July policy meeting revealed divisions among officials regarding the necessity of further rate hikes. AUD/USD Key Events Today The US will release key reports, including the initial jobless claims and the Philadelphia Fed Manufacturing reports. AUD/USD Technical Forecast: Price Decline Reflects Renewed Bearish Enthusiasm. AUD/USD 4-hour chart On the charts, AUD/USD has made new lows after dropping and crossing below the 0.6400 support level. Moreover, this decline has greatly swung away from the 30-SMA, showing renewed enthusiasm among bears. This has also seen the RSI drop to near the oversold region. However, the price will likely pause near the 0.6400 key level before seeking lower support levels. https://www.forexcrunch.com/aud-usd-forecast-aussie-to-9-month-lows-as-employment-dips/
2023-08-16 09:48
Australian wage growth remained stable in the June quarter. Yearly pay increases in Australia unexpectedly slowed, raising hopes that inflationary pressures might weaken. RBA projections anticipate annual wage growth peaking at 4.1% by the end of the year. Today’s AUD/USD outlook is bearish. Australian wage growth remained stable in the June quarter. However, the pace of yearly pay increases unexpectedly slowed. This unexpected slowdown raised hopes that inflationary pressures might weaken, providing a case against further interest rate hikes. With dovish minutes from the July policy meeting also released, investors are more confident that the Reserve Bank of Australia will hold rates in September. The probability of this outcome has risen to 91% from 85%. According to data from the Australian Bureau of Statistics, the wage price index showed a 0.8% rise in the June quarter compared to the previous one. Notably, this growth rate was slightly below the anticipated 0.9% increase. Meanwhile, annual pay growth experienced a slight decline. It moved from a peak of 3.7% in the previous quarter to 3.6% in the current one. Furthermore, this departure marked a shift from the increasing trend observed since the first quarter of 2021. Despite Australia’s low jobless rate of 3.5%, the economy’s performance in terms of job creation is exceeding expectations. Nevertheless, wages are still not keeping up with inflation, impacting real incomes. The RBA’s recently released minutes indicated that the bank envisions a scenario in which inflation remains controlled by the current interest rate level. Their projections anticipate annual wage growth peaking at 4.1% by the end of the year and then subsiding to 3.6% by the end of 2025. AUD/USD Key Events Today Investors will watch sales data from the US to get an idea of consumer spending in the country. Consumer spending drives the broader economy. AUD/USD Technical Outlook: 30-SMA Retaining Selling Pressure AUD/USD 4-hour chart On the charts, AUD/USD is pushing lower after retesting the 30-SMA and the 0.6500 resistance level. The bearish bias is strong because the price respects the 30-SMA resistance. Moreover, the RSI trades below 50, indicating solid bearish momentum. Therefore, bears will likely soon retest the nearest support at 0.6450. However, the bearish momentum in the downtrend has weakened. The RSI has made a bullish divergence that could soon reverse the trend. https://www.forexcrunch.com/aud-usd-outlook-aus-yearly-wage-growth-sees-surprising-dip/
2023-08-16 09:46
Data revealed a record surge in UK basic wages. The UK’s unemployment rate climbed to 4.2% from 4.0%. Market estimates suggest a 55% likelihood of the BoE’s benchmark rates reaching 6% in early 2024. Today’s GBP/USD price analysis is bullish. On Tuesday, the British pound gained ground following data revealing a record surge in UK basic wages. Consequently, this development heightened the Bank of England’s concerns about inflation. The pound marked a 0.12% increase. Initially, it had risen by as much as 0.28% to $1.2720 after the release of the wage data. Notably, British wages, excluding bonuses, surged by 7.8% compared to the same period the previous year, spanning three months ending in June. This upturn represented the highest annual growth rate since comparable records were initiated in 2001. Surprisingly, the UK’s unemployment rate climbed to 4.2% from 4.0%. Analysts noted that this wage rise and unemployment could complicate the Bank of England’s decision-making. Moreover, pay growth appears poised to surpass the rate of consumer price inflation, projected to slow to 6.8% in July. This is according to upcoming data from the ONS on Wednesday. Meanwhile, market estimates suggest a 55% likelihood of the BoE’s benchmark rates reaching 6% in early 2024, up from their current level of 5.25%. Elsewhere, Governor Andrew Bailey remarked earlier that the pace of pay growth exceeded the central bank’s predictions. However, the BoE also hinted that it was nearing a pause in its series of interest rate increases. Bailey and his colleagues might find solace in some indications of a cooling labor market beyond the pay data. GBP/USD Key Events Today Investors will now focus on the US, which will release retail sales data. They expect to see a drop in core retail sales and an increase in retail sales in July. GBP/USD Technical Price Analysis: Bulls Push Above 30-SMA And 1.2701 Resistance. GBP/USD 4-hour chart The pound is pushing above the charts’ 30-SMA and 1.2701 resistance level. Bulls took control at the 1.2625 support level with a strong candle that paused at the 1.2701 resistance. The bulls have now gathered enough momentum to go above this resistance. Moreover, the RSI has crossed above 50, indicating a stronger bullish momentum. If bulls can close above this resistance zone, the price will likely retest the next resistance level at 1.2803. https://www.forexcrunch.com/gbp-usd-price-analysis-pound-soars-amid-upbeat-basic-wages/
2023-08-15 04:08
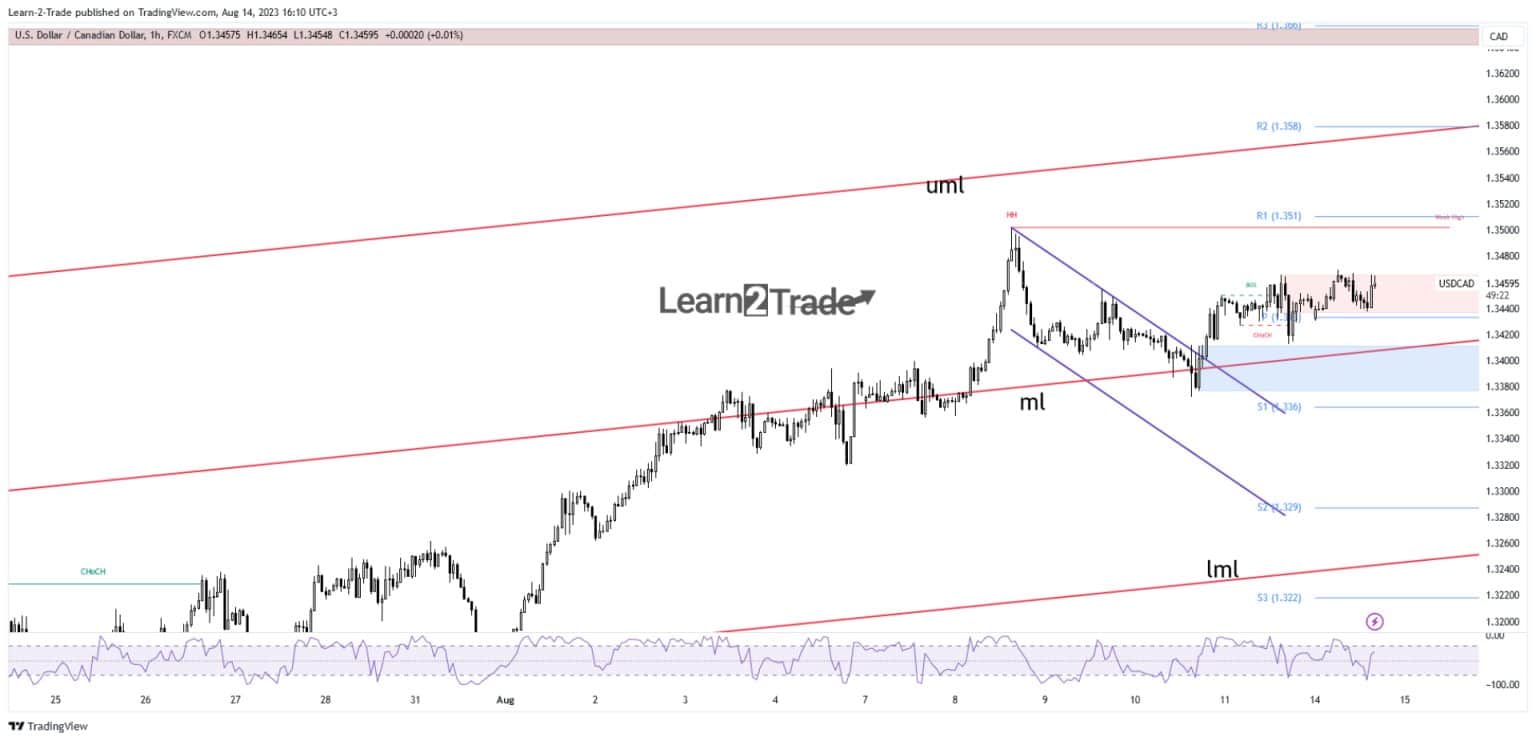
The bias is bullish if it stays above the median line (ml). 3501 represents the first target. The US and Canadian data should be decisive tomorrow. The USD/CAD price edged higher, trading at 1.3462 at the time of writing. The bias is bullish, so a further rise is highly probable. –Are you interested in learning more about making money with forex? Check our detailed guide- The pair may hit new highs if the greenback extends its upside bias. Fundamentally, the US dollar received a helping hand from the US economic figures on Friday. The PPI reported a 0.3% growth beating the 0.2% growth estimated and the 0.0% growth in the former reporting period, while Core PPI increased by 0.3% exceeding the 0.2% growth forecasted. Tomorrow, the fundamentals should remain in the driving seat. The Canadian Consumer Price Index is expected to report a 0.3% growth in July versus the 0.1% growth in June. In addition, the Core PPI, Median CPI, Trimmed CPI, and Common CPI data will also be released. On the other hand, the US Retail Sales and Core Retail Sales indicators are expected to report a 0.4% growth compared to the 0.2% growth in the previous reporting period. Furthermore, the Empire State Manufacturing Index, Import Prices, Business Inventories, NAHB Housing Market Index, and TIC Long-Term Purchases data will also be released. USD/CAD Price Technical Analysis: Strong Buying Momentum USD/CAD price hourly chart Technically, the USD/CAD pair escaped from the minor flag pattern signaling an upside continuation. The median line (ml) of the ascending pitchfork represents dynamic support. As long as it stays above it, the rate should approach and reach new highs. Its failure to reach and retest this line announced strong buyers and bullish pressure. The 1.35 psychological level represents the next upside target. It remains to see how it reacts around the 1.3501 former high. A new higher high, a valid breakout should announce further growth ahead. The ascending pitchfork’s upper median line (uml) represents a potential target if the rate continues to grow. https://www.forexcrunch.com/usd-cad-price-aiming-at-1-3500-eyes-on-canadian-cpi/