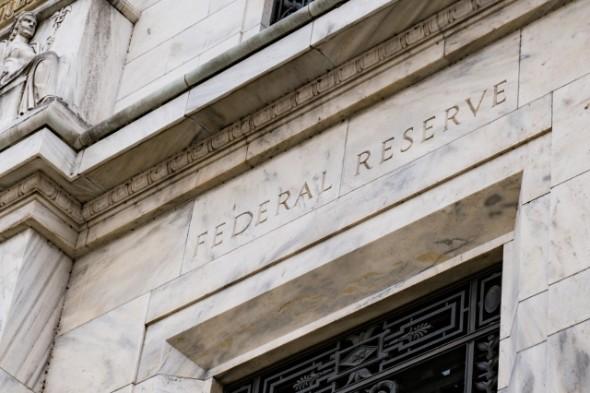
2025-06-09 12:01
Key takeaways The Reserve Bank of India (RBI) surprised the markets by delivering a larger-than-expected 0.50% rate cut in its June MPC meeting. However, the central bank changed the monetary policy stance to “neutral” from “accommodative” previously. The RBI also reduced the Cash Reserve Ratio (CRR) for banks by 1% to 3%. In our assessment, the RBI’s larger-than-expected rate cut was done to front-load the rate cuts rather than being an indication of sharp downside risks to growth. We now expect the RBI to remain on hold in the August and October meetings, before delivering a 0.25% cut in December MPC meeting to take the benchmark rate to 5.25%. We retain our overweight stance on Indian equities and favour large-cap stocks as we believe they are better positioned to navigate the uncertain environment. Given the elevated global uncertainty, we like more domestically-oriented sectors and favour financials, healthcare and industrials. We are bullish on Indian local currency bonds and expect 10-year government bond yields to edge lower by end-2025. What happened? In the Monetary Policy Committee (MPC) meeting on 6th June 2025, the Reserve Bank of India (RBI) surprised the markets by delivering a larger-than-expected 0.50% rate cut. In the lead-up to the meeting, most of the economist surveys by Bloomberg were expecting a 0.25% rate cut by the RBI. Five out of the six MPC members voted for a 0.50% rate cut. However, the central bank changed the monetary policy stance to “neutral” from “accommodative”. The RBI Governor Malhotra highlighted that the shift in the monetary policy stance means that the future policy direction would be largely data dependent. In addition to the jumbo 0.50% rate cut, the RBI also reduced the Cash Reserve Ratio (CRR) for banks by 1% to 3%. The 1% cut will be enacted in a staggered manner with 0.25% cuts each fortnight starting from 6th September. The RBI highlighted that this measure should release approximately INR 2.5tn (USD29.1bn) liquidity in the Indian financial system by November 2025. The RBI lowered Indian repo rate to 5.50%, the lowest since 2022 Source: Bloomberg, HSBC Global Private Banking and Premier Wealth as of 6 June 2025. Past performance is not a reliable indicator of future performance. The RBI kept its FY26 (April 2025-Mar 2026) GDP growth forecast unchanged at 6.5%. RBI Governor Malhotra highlighted that amid global uncertainties, Indian economy was a picture of strength and stability. Private consumption is expected to remain healthy with a gradual rise in discretionary spending and a pick-up in rural demand, due to a good monsoon season. Governor Malhotra also mentioned that while India has agreed on a trade deal with the UK and is negotiating with other countries, the central bank remains vigilant against downside growth risks due to geopolitical tensions. RBI Governor Malhotra also highlighted that the outlook for food inflation had softened while the core inflation outlook remained benign. As a result, the RBI lowered its FY26 inflation projection to 3.7% from 4.0% previously. Governor Malhotra also said that the battle against inflation, which has declined to a six-year low, had been won and indicated that the central bank would increase its focus on supporting growth. In our assessment, RBI’s larger-than-expected rate cut was done to front-load the rate cuts rather than being an indication of sharp downside risks to growth. The change in monetary policy stance to “neutral” and the RBI governor’s comments suggest that this was done to ensure a minimal time lag in the transmission of monetary easing to the real economy. Investment implications We now expect the RBI to remain on hold in the August and October meetings, before delivering a 0.25% cut in December MPC meeting to take the benchmark rate to 5.25%. RBI’s monetary policy decision was viewed positively by the equity markets, which rose sharply following the announcement. Easier monetary policy to boost growth is generally supportive for the broader market. In particular, the 0.50% rate cut and the lowering of CRR are positive for banks, real estate and the consumer discretionary sector. 10-year government bond yields declined initially before edging 2-3bps higher at the time of writing, while USD/INR was largely unchanged. We retain our overweight stance on Indian equities, as most of the fundamentals and technical factors remain supportive. India’s headline CPI inflation declined to the lowest level in nearly 6 years Source: Bloomberg, HSBC Global Private Banking and Premier Wealth as of 6 June 2025. Past performance is not a reliable indicator of future performance. From a fundamental perspective, in addition to the tailwind from robust GDP growth, we see (i) potential signs of stabilisation in the earnings trajectory, with expectations of double-digit earnings growth and (ii) a healthy Return on Equity (RoE) of around 15% offsetting the concerns about valuations. From a technical perspective, the resilience of domestic investors, which was a big unknown, is viewed as a big positive. Also, there are visible signs of the return of foreign investor inflows and from a seasonal perspective, June – September has historically been a strong period for Indian equities. We favour large-cap stocks over the small- and mid-cap stocks. Large caps continue to trade at a sizeable discount and their larger size makes them more defensive should market volatility spike again. Given the still-elevated global uncertainty, we prefer domestically-oriented sectors, with a greater exposure to the Indian consumption story. We continue to favour the financials, healthcare and industrials sectors. We are bullish on Indian local currency bonds and expect them to outperform cash in 2025. We expect 10-year government bond yields to edge lower by end-2025. https://www.hsbc.com.my/wealth/insights/market-outlook/special-coverage/rbi-delivers-a-surprise-cut/
2025-06-09 07:04
Key takeaways Emerging market stocks have performed well in 2025, with most outpacing the US, and a few – like Latin America, China, and South Korea – delivering strong double-digit returns. Current optimism for Chinese technology stocks could not be more different to the bearishness of 2022. Back then, tech firms were under scrutiny from regulators, and even faced the threat of US delisting. High real yields and a weaker US dollar are providing a strong setting for emerging market local currency debt this year. But there are also important structural changes boosting investor confidence – with South Africa a good example. Chart of the week – Proactive ECB versus hamstrung Fed Eurozone core inflation hit its lowest level since January 2022 last week, dropping to 2.3%, and the disinflation trend looks set to continue. US tariffs are a negative demand shock for the eurozone, which will help keep prices in check. In addition, lower oil and gas prices, a stronger euro, and the possibility of more Chinese goods being diverted from the US to Europe all point to moderating inflation pressures. This leaves the ECB in an enviable position of being able to lean against downside growth risks by cutting rates, as it did for the eighth time this cycle at its June meeting. Meanwhile, the Federal Reserve is in a trickier position. For the US, tariffs are a supply shock that could keep inflation well above target until mid-2026. And a weaker USD adds to price pressures. So, the Fed is likely to remain cautious on policy easing unless growth deteriorates sharply. But any growth hiccup could raise further questions about US fiscal sustainability, given it would mean even wider deficits and more rapid accumulation of debt. In such a scenario, while the Fed may decide to cut rates aggressively, longer-term yields could prove sticky, with US stocks remaining volatile. By contrast, ECB rate cuts and Germany’s improving fiscal position – with a relaxation of its “debt brake” a potential game-changer for structural growth – mean that Bunds could perform well in a downside scenario. We think these “policy puts” can provide a powerful catalyst to unlock value in many European stock markets on a longer-term basis. Duration in core eurozone bonds also looks like an attractive option for multi-asset investors looking for “safety substitutes” just as the haven attributes of US Treasuries are under question. Market Spotlight Currency conundrum In global portfolios, investors face a conundrum when it comes to the unintended or unrewarded risks of dealing with multiple currencies. And despite this being an obvious potential hazard when investing across international markets, there’s no unified approach to it. Some of the simplest workarounds involve limiting currency exposure by either staying heavily invested in a home market or by fully hedging all foreign currencies. But the research shows both strategies can damage risk-adjusted returns and miss the diversification benefits of having specific currency exposures. Some research studies find that it could be preferable for investors to consider a long-term hedging strategy alongside a more active approach to currency management using ‘dynamic currency overlays’. These overlay strategies can be guided using signals that capture risk premia like carry, value, and momentum, and which have been shown to be effective at generating excess returns historically. But portfolio risk constraints can be a limiting factor – so investors need to think carefully about how to apply these strategies to maximise returns. The value of investments and any income from them can go down as well as up and investors may not get back the amount originally invested. Past performance does not predict future returns. The level of yield is not guaranteed and may rise or fall in the future. For informational purposes only and should not be construed as a recommendation to invest in the specific country, product, strategy, sector, or security. Diversification does not ensure a profit or protect against loss. Any views expressed were held at the time of preparation and are subject to change without notice. Any forecast, projection or target where provided is indicative only and is not guaranteed in any way. Source: HSBC Asset Management, Bloomberg. Data as at 7.30am UK time 09 June 2025. Lens on… Emerging differences Emerging market stocks have performed well in 2025, with most outpacing the US, and a few – like Latin America, China, and South Korea – delivering strong double-digit returns. Key to that has been sustained weakness in the US dollar – which tends to boost EM economies – and a broadening of attention from the US to EAFE markets. Yet, despite robust overall returns, performance dispersion across EMs continues to be wide. That’s down to a range of local idiosyncrasies, structural stories, and, more recently, the sensitivity of economies to tariffs. Differing returns between China and India are a case in point. Indian equities got off to a subdued start this year, with the economy facing cyclical headwinds, but have rallied in Q2. But Chinese stocks have done even better amid excitement around tech (see next story), strong profits growth, and a sense that authorities retain a policy put. The increasing shift to a multi-polar world will lead to more divergence like this, with historical country correlations being disrupted. Investors should pay close attention to local drivers and catalysts to capture genuine diversification upside in EMs. Terrific tech Current optimism for Chinese technology stocks could not be more different to the bearishness of 2022. Back then, tech firms were under scrutiny from regulators, and even faced the threat of US delisting. Since then, there has been a shift in policy tone, with China’s government emphasising “new quality productive forces”, encouraging high-quality developments, sci-tech innovation, and self-sufficiency in advanced technologies. A macro recovery since 2023, supported by policy stimulus, has also helped. So too has been the major reassessment of China’s ability to innovate at a relatively low cost following advancements by AI firm, DeepSeek. It now appears that Chinese firms could accelerate AI development in areas where homegrown tech is already first class, such as humanoid robots, electric vehicles, and biotech applications. Chinese tech stocks have driven performance in the offshore market this year. With the Q1 reporting season nearly over, profits growth has been strong – led by internet companies and e-platforms – and AI adoption is growing. With Chinese stocks trading at a discount to global peers, technology – and AI in particular – could be a re-rating catalyst, just as the moat around US tech appears to be shrinking. Rand designs High real yields and a weaker US dollar are providing a strong setting for emerging market local currency debt this year. But there are also important structural changes boosting investor confidence – with South Africa a good example. Its government is embarking on reforms to modernise and transform network industries and boost productivity. The economy runs a modest current-account deficit and recorded its first surplus in two decades in 2021-22. On the fiscal front, its recent budget highlighted a commitment to stabilising debt. The premium that South African government rand-denominated bonds pay over equivalent-maturity swaps, a well-known measure of fiscal risk, remains high relative to IMF budget projections. If those expectations are accurate, it implies a favourable fiscal outlook where yields should gradually decline. Meanwhile, the South African Reserve Bank has been conservative in easing policy, which has kept bond yields high, but inflation has stabilised below the central bank’s 3-6% target range. This paves the way for more rate cuts, and makes it easier to move to a single point target at 3%. This could help anchor inflation expectations and create more stable inflation. Past performance does not predict future returns. The level of yield is not guaranteed and may rise or fall in the future. For informational purposes only and should not be construed as a recommendation to invest in the specific country, product, strategy, sector, or security. Diversification does not ensure a profit or protect against loss. Any views expressed were held at the time of preparation and are subject to change without notice. Index returns assume reinvestment of all distributions and do not reflect fees or expenses. You cannot invest directly in an index. Any forecast, projection or target where provided is indicative only and is not guaranteed in any way. Source: HSBC Asset Management. Macrobond, Bloomberg. Data as at 7.30am UK time 09 June 2025 Key Events and Data Releases Last week The week ahead Source: HSBC Asset Management. Data as at 7.30am UK time 09 June 2025. For informational purposes only and should not be construed as a recommendation to invest in the specific country, product, strategy, sector or security. Any views expressed were held at the time of preparation and are subject to change without notice. Any forecast, projection or target where provided is indicative only and is not guaranteed in any way. Market review Positive risk sentiment prevailed last week despite lingering US-China trade tensions. The OECD downgraded global growth projections, warning that agreements to ease trade barriers would be “instrumental” in reviving investment. In the US, the dollar weakened against a basket of major currencies, while government bonds firmed on signs of weakness in “soft data”. In the eurozone, the ECB lowered rates by 0.25% to a “neutral level”, with ECB president Lagarde signalling a summer pause in the easing cycle. US and European IG and HY credits consolidated. In stocks, US equities built on recent gains, led by “Magnificent 7” tech giants. European stocks also rose. Japan’s Nikkei 225 traded sideways as JGBs stabilised. EM Asian equity markets moved broadly higher, but Latin American stock markets were weaker. In commodities, oil prices and gold both climbed. https://www.hsbc.com.my/wealth/insights/asset-class-views/investment-weekly/proactive-ecb-versus-hamstrung-fed/
2025-06-04 12:02
Key takeaways Labour market weakness continued at pace in April, but perhaps a tentative sign of improvement in May. Retail sales demand has picked up, but is yet to see a translation into broader consumption. Higher than expected inflation complicates both monetary and fiscal policy. Source: HSBC Finding signals through the fog It’s been a period of conflicting economic data releases for the UK economy, in part a reflection of the data being for the months either side and including April, which saw a lot of volatility and could prove a key inflection point for the UK economy. On the one hand, labour market indicators for April continued to show weakness in labour demand. PAYE employment fell 33k and, while that number will likely be revised, nearly every sector has reported a decline in vacancies since the start of the year (chart 1). Moreover, surveys pointed to a faster pace of headcount reductions and weaker demand for labour. And, although the labour market has been softening since 2022, the higher unit labour costs associated with a sharp rise in the national living wage and employer national insurance contributions hike provided further impetus. However, those factors came into effect in April and the PMI employment index was marginally improved in May, so labour market sentiment may, at least, be stabilising. Despite weaker employment prospects, retail sales reported a fourth consecutive month of growth in April and a 5.0% rise y-o-y, its strongest pace of growth in three years. Some caution is needed in taking strong signals from retail sales as overall household consumption growth has struggled to find a footing amid continued rate pass through and cost of living increases. However, the upward trend in retail sales demand is in full swing (chart 2), forward-looking components of consumer confidence saw decent gains in May, and net household deposit growth has continued to slow to more historically normal rates. Inflation surprises make for policy conundrum A plethora of known price rises in April and some surprise underlying price growth saw headline inflation accelerate to 3.5% y-o-y. More concerningly, services price inflation jumped to 5.4% y-o-y, higher than the BoE had forecast. Combined with still elevated wage growth, initial estimates from PAYE data point to wage growth of 6.4% y-o-y in April, which means greater uncertainty over the future path for rate cuts. Indeed, financial markets have pulled back expectations on rate cuts this year (chart 3). Longer-dated government bond yields have also continued to rise amid global uncertainty and a large risk premium associated with fiscal policy. That raises the risk of lower fiscal headroom in the autumn and a ‘doom loop’ for fiscal policy. Source: Macrobond, ONS, HSBC Source: Macrobond, ONS, HSBC Source: Bloomberg, HSBC forecasts https://www.hsbc.com.my/wealth/insights/market-outlook/uk-in-focus/finding-signals-through-the-fog/
2025-06-03 12:02
Key takeaways Artificial Intelligence (AI) is transforming the way we live. It links to our potential to deliver a speedy net-zero transition through several channels. The emissions associated with energy used help in catalysing funding for the transition. Using technology for monitoring, policing and predicting disruptions to livelihoods are all relevant. Taking all of these influences into account, we think the growth of AI is beneficial for delivering and managing net zero positive outcomes. Artificial intelligence (AI) offers many positives to help speed up the transition to a net zero world. Our main questions are whether it will speed up or slow down emissions control, whether it can help channel capital for low-carbon financing, and how it can help monitor and predict the consequences of warmer temperatures. As we discuss in this report, on balance, we think the growth of AI is a positive for net zero delivery and provides governments with a toolkit to progress net zero ambitions. Did you know? 10x more energy is consumed for AI powered search versus standard keyword search AI consumes 1.2% of total power demand, which is additive to the electricity, and therefore emissions, picture Data centres use c4.4% of total US electricity, equivalent to the average annual consumption of 14m US households China’s power consumption from AI could be c5x higher by 2030 than now, an annual growth rate of c32% Global data centre spending is expected to reach over USD1trn by 2029, with half of this attributable to AI AI can improve the efficiency of installed wind turbines by up to 20%, their lifespan by up to 10% and reduce costs by up to 15% Source: de Vries, Alex, The growing energy footprint of artificial intelligence, Joule, 18 October 2023; Powering Intelligence: Analysing Artificial Intelligence and Data Centre Energy Consumption, EPRI, 28 May 2024; ‘Next-Gen Wind Farms: Dell’Oro Group, 2025; Wind Turbine Optimisation with AI’, Datategy, 17 January 2024 Speeding up the net zero transition AI is experiencing unprecedented traction and is reshaping various industries. It’s enabling smart decision-making by leveraging advances in machine learning, natural language processing and generative modelling. There are several ways in which the growth of AI has read-across for the speed of delivering a net zero economy. 1. Emissions control The increasing adoption and sophistication of AI models are leading to greater power demand and in turn, impacting emissions levels. Indeed, carbon emissions for the training of more recent AI models have increased significantly, with GPT-3 (released in 2020) emitting 588 tons, GPT-4 (2023) emitting 5,184 tons, and Llama 3.1 405B emitting (2024) 8,930 tons. On the positive side, AI can help drive the energy transition if new data centres are in places where clean power is already used or can be scaled up. Alternatively, above-forecast power consumption from data centres in areas with more carbon intensive fuel sources (e.g. coal) will likely add more CO2 than expected from business-as-usual pathway assumptions. Current AI trends would likely add to the emissions picture, given that fossil fuels account for 60% of the global power mix, although this hides the locational aspect of data centres. If the power sector decarbonises faster than the energy demands of advanced AI, this would be a win for the net zero transition. Separately, AI monitoring tools can help manage emissions in the land-use change and forestry sectors, which is a positive for a net zero outcome. Power use is up 28% in the last 10 years; renewables are growing in share Source: 2024 Energy Institute Statistical Review of World Energy. Others*: Based on gross output that includes uncategorised generation, statistical differences and sources not specified elsewhere, e.g. pumped hydro, non-renewable waste and heat from chemical sources. In terms of renewables, AI can help reduce emissions by optimising energy integration, storage, distribution and forecasting production. A significant problem faced by the adoption of renewable energy is intermittency; integrating AI helps manage fluctuations, ensuring a stable and reliable supply. Predictive maintenance also helps reduce downtime and repair costs. 2. Financing a net zero future The Independent High-Level Expert Group on Climate Finance estimates that, by 2030, between USD6.3trn and USD 6.7trn per year will be needed globally to meet climate goals. This includes substantial investments in the clean energy sector, loss and damage, natural capital and just transition. We think there’re three channels through which the growth of AI can help fund the energy transition: i. Catalysing renewable energy investment: Increased interest in data centre hub locations could spark further grid investment and more efficient processes for streamlining projects. Ireland, for example, recently injected EUR750m into developing its electricity grid to cater to increased AI demand. ii. Contributing to GDP: Funding for the low-carbon transition will come from a variety of sources, including country public finances and sovereign wealth funds. As AI grows as a sector, it becomes an increasingly important contributor to GDP. PwC estimates that AI could contribute up to USD15.7trn to the global economy by 2030. iii. Improving access to capital: AI technology can help attract investment into nature-based solutions by providing more robust analysis of projects, such as improving data accuracy, monitoring carbon footprints and optimising project selection, which ensures investments are directed toward impactful initiatives. By 2030, contribution of AI to GDP by region Source: PwC, HSBC *Note: GCC4 includes Bahrain, Kuwait, Oman and Qatar 3. Building resilience to disruptive impacts Inclusive resilience relates to productivity, both in terms of people’s ability to find roles in transition sectors and human activities linked to productivity in their jobs. Additionally, within a country, the levels of social equity impact its ability and willingness to transition. We believe AI can be a powerful tool for managing environmental impacts, alongside enhancing economic productivity. Applications include monitoring and predicting extreme weather events, managing biodiversity conservation, addressing food loss and waste challenges and providing optimal utilisation of resources. This enables labour productivity by minimising work-hour loss due to unforeseen circumstances, such as road closures from flooding that delay employees from getting to and from work. Governance We think a lack of data on the precise scale of AI’s environmental impacts hinders policymakers’ and investors’ ability to fully assess risks. Current regulatory initiatives on data centres focus on optimising energy efficiency and mainly set minimum targets or guidelines for firms. Indeed, the European Commission requires data centre operators to report annually on energy and water use, waste heat reuse and renewable energy consumption. In our view, enhanced disclosure requirements and assessment frameworks across AI supply chains are needed to bring more clarity to investors, governments and other stakeholders. The following aspects should be considered: AI compute: The production of, and the end-of-life strategy for, hardware components affect the lifecycle impacts of AI systems Infrastructure (e.g. data centres): The location, electricity sources, materials, water and other resources, as well as how facilities are connected, built and managed at the end of their life, are all relevant considerations Data and algorithms: Approaches to data collection, transmission, storage and management, as well as model design and training choices, can reduce the energy demands of AI models Deployment of AI: The behaviour of end users plays an important role in determining the overall environmental footprint of AI systems. As some markets are currently developing or looking to implement mandatory reporting requirements for climate-related disclosures in line with the International Sustainability Standards Board’s standards, we think there’s an opportunity for policymakers to determine how these reporting requirements should be applied by AI developers and users, data centre operators and hardware manufacturers. Conclusion How emissions are controlled is relevant to investors because country plans and economic rationale define climate goals, which impact the energy system and connect to economic activity. AI is relevant in this context because the increased adoption and sophistication of AI models lead to increased power demand, in turn impacting emissions levels. The emissions associated with energy used and the use cases for process optimisation, help in catalysing funding for the transition, and using the technology for monitoring, policing and predicting disruption to livelihoods are all relevant. Taking all these influences into account, we think the growth of AI is beneficial for delivering and managing net zero positive outcomes. https://www.hsbc.com.my/wealth/insights/esg/why-esg-matters/ai-friend-or-foe-for-net-zero-transition/
2025-06-02 12:02
Key takeaways US trade court ruled that US import tariffs imposed for national emergency reasons are unlawful. With the appeals process having already resulted in a temporary “stay” to keep them in place… …the USD’s initial bounce was short-lived; we still expect the USD to be on softer ground in the months ahead. The US Dollar Index (DXY) rallied past the 100 level after the US Court of International Trade (CIT) unanimously ruled on 28 May that tariffs imposed on the basis of a national emergency (International Emergency Economic Powers ActIEEPA) were unlawful and should be removed within ten days (Bloomberg, 29 May 2025). The judgement blocks the reciprocal tariffs, the baseline 10% tariffs, and the fentanyl-related tariffs on China, Canada, and Mexico. Sector-specific tariffs enacted using different trade legislation (Section 201, 232, and 301) remain in place. The USD’s initial bounce shows that FX markets have retained their reaction function that good news on the trade front (i.e. lower tariffs) is also good news for the USD. It seems the lens through which markets are examining tariffs is whether it reduces or increases US policy uncertainty. FX markets may also reward the USD for lower tariffs because it is seen as reducing the drag on US growth. Source: Bloomberg, HSBC However, the USD bounce was short-lived. The US administration immediately lodged an appeal with the Federal Circuit Court where it won a temporary “stay” on the CIT’s order to remove the IEEPA tariffs. A full appeal could take months. But US President Trump has other options for delivering tariffs, for example, the sector-specific tariffs (which will involve a consultation period before going in place) or universal tariffs of up to 15% for a maximum of 150 days under Section 122. So, FX markets have chosen not to view this CIT decision as a gamechanger, but the ruling does complicate matters. It also removes the threat of swift punitive tariffs from the US administration’s toolkit. Tariff pauses and the CIT decision may create a sense of a return to normality, but tariffs remain elevated, and the threat of a return to even higher tariffs in July looms large. The futures market expects the Federal Reserve (Fed) to adopt a “wait and see” approach, with the next rate cut only fully priced for the 28-29 October meeting (Bloomberg, 29 May 2025). After assessing cyclical, political, and structural factors, we think that the USD should be on softer ground in the months ahead. https://www.hsbc.com.my/wealth/insights/fx-insights/fx-viewpoint/usd-us-trade-tariff-uncertainty-continues/
2025-06-02 07:04
Key takeaways Emerging market local currency debt looks positioned to do well in a backdrop of high real yields, strong fundamentals, and a weakening US dollar. Last week saw the last of the Magnificent Seven mega-caps deliver Q1 profits numbers – which once again beat analyst expectations. Asset market volatility this year has focused investor attention on ways of giving portfolios sufficient ballast. Chart of the week – Bond market vigilantes are back The “bond market vigilantes” have been spotted riding back into town. Yields on long-dated bonds across the G7 have been rising recently, with a marked steepening in 2y-30y spreads since the end of February. The initial pick-up in yields during March coincided with the news of a major fiscal support package in Germany, which boosted Bund yields along with their French and Italian equivalents and likely pushed up yields globally. This element of the move in long-dated rates can be seen as positive – reflecting a reflation of the eurozone economy driven by the country with ample fiscal space to do it. Since early April, the 2y-30y spreads for Germany, France and Italy have moved very little, but those for the US, Japan and the UK have moved higher. This is potentially more worrying. It coincides with a spike in US policy uncertainty, forcing higher bond risk premiums, together with growing concerns about the fiscal position of the US, Japan, and the UK. The US administration’s fiscal plans imply a further widening of the deficit from an already-unsustainable level. Japan’s gross government debt of well over 200% of GDP is sustainable in a low global rate environment, but not when global yields move to pre-GFC levels. As Japanese yields rise, self-reinforcing dynamics can take over – with higher yields raising questions over sustainability, driving risk premiums higher, in turn putting more pressure on sustainability. For investors, developments in the bond market – and the impact on asset prices – is a key focus. With US Treasuries in turmoil, traditional safe assets are less reliable (see page 2), while higher rates could eventually weigh on stocks. With the risk of “deficits forever”, the bond vigilantes won’t be leaving any time soon. Market Spotlight Building new synergies Over the next 25 years, investments totalling an estimated USD150 trillion are going to be needed to achieve global energy transition targets. Key to that will be the development of infrastructure projects in areas like clean energy, transport, and digital. It comes at a time when traditional lending is scaling back in this space – and according to some Infrastructure Debt specialists, it’s leaving a financing gap that is driving strong demand from both companies and investors for private credit in infrastructure funding. Large-scale infrastructure projects often attract financing from major institutions, which is why infrastructure debt has historically been dominated by insurance companies seeking long-term, investment-grade assets. Yet, specialists see mid-market deals (of USD50-250 million) remaining largely underserved. It is an area now attracting pension funds, family offices, and investors seeking higher-yield, shorter-duration opportunities. For investors that allocated heavily to direct lending in recent years, it also offers a potentially lower-risk alternative while still offering attractive returns versus public markets. Overall, the synergy between private credit and infrastructure financing is reshaping how institutional investors approach alternative assets. The value of investments and any income from them can go down as well as up and investors may not get back the amount originally invested. Past performance does not predict future returns. The level of yield is not guaranteed and may rise or fall in the future. For informational purposes only and should not be construed as a recommendation to invest in the specific country, product, strategy, sector, or security. Diversification does not ensure a profit or protect against loss. Any views expressed were held at the time of preparation and are subject to change without notice. Any forecast, projection or target where provided is indicative only and is not guaranteed in any way. Source: HSBC Asset Management, Bloomberg. Data as at 7.30am UK time 30 May 2025. Lens on… Emerging diversifiers Emerging market local currency debt looks positioned to do well in a backdrop of high real yields, strong fundamentals, and a weakening US dollar. Indeed, strengthening EM currencies, combined with falling inflation, are allowing EM central banks to ease policy, further boosting the appeal of EM local bond markets to global investors. And while US tariffs could drag on growth, the demand shock could be disinflationary for EMs, potentially speeding up their policy easing cycles. Despite broad tailwinds, it makes sense to take a differentiated view of the EM bond universe. EM currencies – especially those backed by large external surpluses, some of them in Asia – are likely to outperform. EMs have built up buffers against external risks at differing speeds, and they have varying exposure to global trade. For Indonesian bonds, historically high real yields, low inflation, manageable external balances, moderate debt levels, and reassurance from the finance minister have alleviated market concerns over fiscal risks. A Q1 profits bang – but 2025 whimper? Last week saw the last of the Magnificent Seven mega-caps deliver Q1 profits numbers – which once again beat analyst expectations. Overall, US Q1 profits have delivered a bang, growing 13% year-on-year versus an expected 7% at the start of the quarter. But while sectors like healthcare and technology have raised guidance for the full year, most sectors are pencilling-in flat to falling growth in 2025. In fact, consensus y-o-y profits growth for 2025 has fallen from 14% in January to just over 9% today. Energy, materials and consumer discretionary have seen the deepest downgrades. Revisions in consumer discretionary follow a stellar run for the sector, which is up by 218% over 10 years. But with a 12-month forward price/earnings valuation of 29x (higher than US Tech on 27x). Industrials, which is not cheap on 23x, has exposure to the US government's focus on infrastructure and re-shoring. Beyond the US, full year consensus for Emerging Markets are better in most sectors. And with EM on a PE of 12.3x versus the US on 21.5x, EM stocks could offer more of a valuation buffer against setbacks. In search of safety Asset market volatility this year has focused investor attention on ways of giving portfolios sufficient ballast. For much of the first two decades of this century, a negative correlation between stocks and bonds meant bonds provided a reliable cushion in equity market downturns – good news for 60/40 portfolios. But since 2021, this dynamic has reversed. Resurgent inflation and shaky public finances led to bonds and equities selling off in tandem. For investors, it removed a comfort blanket they’ve relied on for years. Research by some ETF and Indexing teams shows the current correlation landscape resembles patterns seen in the 1970s, 80s, and early 90s – a time when inflationary pressures drove positive correlations between stocks and bonds. The relationship between inflation and economic growth influences how asset classes behave relative to each other. When inflation dominates, as it has post-pandemic, bonds are a less reliable hedge. That’s compounded by concerns over high deficits keeping bond yields sticky. In sum, it poses a challenge to the 60/40 model and may require a change in how investors think about risk and diversification. Past performance does not predict future returns. The level of yield is not guaranteed and may rise or fall in the future. For informational purposes only and should not be construed as a recommendation to invest in the specific country, product, strategy, sector, or security. Diversification does not ensure a profit or protect against loss. Any views expressed were held at the time of preparation and are subject to change without notice. Index returns assume reinvestment of all distributions and do not reflect fees or expenses. You cannot invest directly in an index. Any forecast, projection or target where provided is indicative only and is not guaranteed in any way. Source: HSBC Asset Management. Macrobond, Bloomberg. Data as at 7.30am UK time 30 May 2025. Key Events and Data Releases Last week The week ahead Source: HSBC Asset Management. Data as at 7.30am UK time 30 May 2025. For informational purposes only and should not be construed as a recommendation to invest in the specific country, product, strategy, sector or security. Any views expressed were held at the time of preparation and are subject to change without notice. Any forecast, projection or target where provided is indicative only and is not guaranteed in any way. Market review Risk sentiment strengthened last week as the Q1 earnings season neared its end, and investors continued to monitor the trade negotiations and tariff developments. The dollar index rebounded modestly, and Treasury yields pulled back following solid auction results. European yields also declined. US and Euro credit spreads narrowed, with HY outperforming IG. US equities saw broad-based gains, recovering some of the prior week's losses. European markets broadly advanced, as Japan's Nikkei 225 rose amid a weaker yen and a retreat in JGB yields. Other Asian equities lacked clear direction, with South Korea's Kospi leading gains. India's Sensex and China’s Shanghai Composite traded sideways, while Hang Seng fell. In commodities, oil prices declined before an OPEC+ meeting to discuss July output, accompanied by softer gold and copper prices. https://www.hsbc.com.my/wealth/insights/asset-class-views/investment-weekly/bond-market-vigilantes-are-back/